Economic Disparities in the European Union: Insights from 2018 Meetings
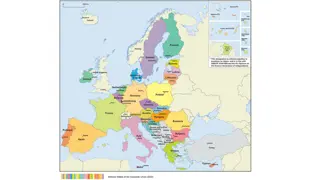
The data presented showcases wage inequalities, compensation rates, minimum wages, monthly salaries, and low-paid workers' share in the EU, particularly focusing on Bulgaria. The figures indicate disparities among EU countries in terms of hourly wages, minimum wage levels, average monthly salaries, and labor productivity. The information sheds light on the economic landscape within the EU, highlighting both the high and low ends of the spectrum.
Download Presentation

Please find below an Image/Link to download the presentation.
The content on the website is provided AS IS for your information and personal use only. It may not be sold, licensed, or shared on other websites without obtaining consent from the author.If you encounter any issues during the download, it is possible that the publisher has removed the file from their server.
You are allowed to download the files provided on this website for personal or commercial use, subject to the condition that they are used lawfully. All files are the property of their respective owners.
The content on the website is provided AS IS for your information and personal use only. It may not be sold, licensed, or shared on other websites without obtaining consent from the author.
E N D
Presentation Transcript
European Economic and Social Committee Bulgarian Presidency of the Council of the European Union Group II Workers' Group EXTRAORDINARY WORKERS' GROUP MEETING 21-22 June 2018, Sofia "Working Europe and European Pillar of Social Rights Wage inequalities in EU Lyuben TOMEV, Director of ISTUR at CITUB
Compensation of employees per hour worked - 2017 Euro 45 38.539.5 40 32.233.434.1 35 29.229.7 30 23.1 25 20 15 8.610.211.2 8.4 7.6 10 5.6 5.1 5 0 Bul Rom Hun Lit Lat Slk Gre EU28 Swe Fin Ger Fra Net Bel Den
Compensation per hour worked 2017 . C/1h in Bulgaria 5.1 EUR ( U 23.1) Nominal gap 4.5 times, and in PPS 2.2 times Comparative level of C/1h in PPS 46.3% of EU 2007 . C/1h in Bulgaria 2.3 EUR ( U - 19.5) Nominal gap 8.5 times, and in PPS 3.9 times Comparative level of C/1h in PPS 25.6% of EU
Minimum wages levels and growth rates (2018/2017) High levels of MW Luxembourg, Ireland, Netherlands, Belgium, France, Germany, UK (1999- 1463 EUR), average rate - 1.8% Middle levels of MW Spain, Slovenia, Malta, Greece, Portugal (859-677 EUR), average rate 2.9% Low levels of MW (the 10 new member states: Poland 503, Bulgaria 261 EUR), average rate 8.4%
Average monthly salary 2017 (Gross, Net and in PPS) State Gross (EUR) 542 Net (EUR) 423 Net (PPS) 887 Bulgaria Denmark 5191 3270 2436 Luxembourg 4412 3159 2612 Netherlands 2855 2155 1944 Estonia 1221 957 1305 Slovakia 980 748 1121 Hungary 955 635 1076
Low paid workers relative share (2014) Employees on full working time with gross wage bellow 67% of median wage (Source: Eurostat Structure of earnings) 30 25.5 24.4 25 22.8 21.3 18.718.2 20 15.1 14.8 15 12 8.8 10 5.3 3.8 5 2.6 0 Lat Rom Est UK CzR Bul Mal Aus Por Fra Fin Bel Swe
Apparent labour productivity and average personnel costs in Manufacturing 2015 (thousand EUR per employed/employee) 80 73.6 70 58.8 60 55.1 50 42.4 ALP 40 APC 28.7 27.3 30 17.4 17.5 20 16.2 12.8 11.4 9.6 7.6 10 5.7 0 Germany Italy Portugal Slovakia Latvia Romania Bulgaria
Wage adjusted labour productivity and gross operating rate in Manufacturing 2015 (%) 250 200.9 200 180.7 167.9 167.7 164 138.6 150 133.6 WALP GOR 100 50 12.8 11.1 9.8 8.8 8.6 7 9.1 0 Germany Italy Portugal Slovakia Latvia Romania Bulgaria
Average wage in EUR and PPS in Manufacturing 2017 5000 4552 4407 4500 4000 3500 3000 2526 2464 EUR 2500 PPS 2000 1516 1229 1500 1249 1233 1032 1031 1000 878 1000 653 477 500 0 Germany Italy Portugal Slovakia Latvia Romania Bulgaria
Main conclusions from international comparisons In the Bulgarian industry there is social dumping and low labour costs. Wages and labour costs are much lower than the labour productivity; In the sectors where the nominal labor productivity is lower, this is offset by a higher rate of profit; There is a significant problem in the distribution of added value between labor and capital in favor of capital; There is significant difference between the pay of labour in Bulgaria and the other member states from 140% to 950% (in nominal terms); Even when adjusted nominal rates with comparative price levels, the pay gap remains high from 120% to 440% higher wages in the other member states compared to Bulgaria.
Policy recommendations These differences can`t be overcome within the expected upward convergence if the imposed social dumping and cost competitiveness policy does not change; There is a need for: - The emergence of new quality high added value jobs; - Greater fairness in the distribution of added value between labor and capital; Important role of the ETUC Initiative Alliance for upward convergence of wages


