Doctoral Research Progress Review and Roadmap Presentation
Scholar's semester progress review, Ph.D. course work details, tentative roadmap for Ph.D. study, research progress, tasks for the next six months, summary of completed research work, workshops attended, and slide structure plan for presentation focusing on using graphs for data visualization.
Download Presentation

Please find below an Image/Link to download the presentation.
The content on the website is provided AS IS for your information and personal use only. It may not be sold, licensed, or shared on other websites without obtaining consent from the author. Download presentation by click this link. If you encounter any issues during the download, it is possible that the publisher has removed the file from their server.
E N D
Presentation Transcript
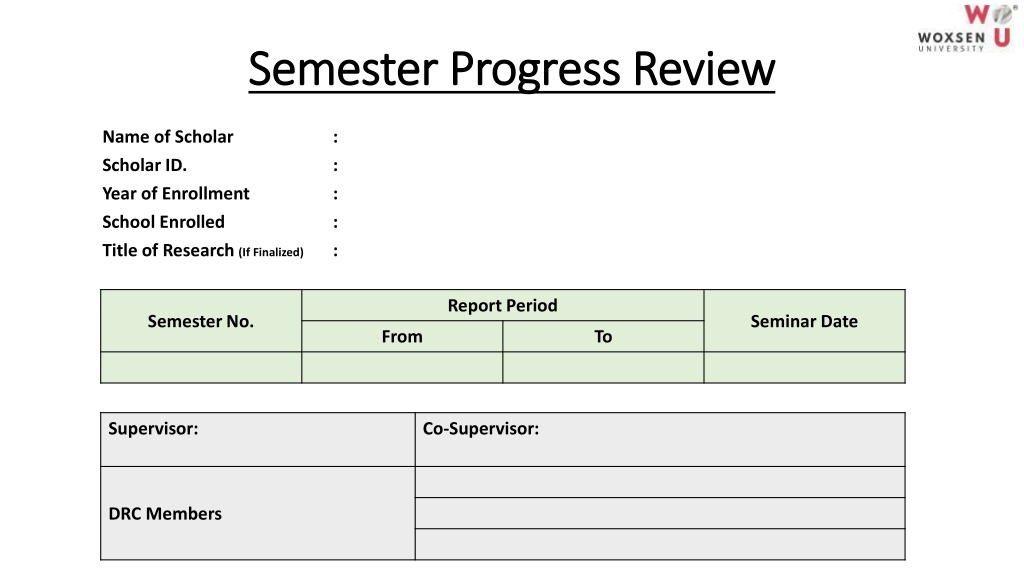
Semester Progress Review Semester Progress Review Name of Scholar Scholar ID. Year of Enrollment School Enrolled Title of Research (If Finalized) : : : : : Report Period Semester No. Seminar Date From To Supervisor: Co-Supervisor: DRC Members
Ph.D. Course Work Details S.No Code Courses Sem Grade 1 2 3 4 Note: Please mention semester as Fall, Spring or Summer followed by respective academic year
Tentative Roadmap - PhD Study S.No Activity Target Date Remarks *** Please mention detailed future road map specifically the research plan, tentative date for presenting research proposal/synopsis/thesis submission ***
Research Progress Last Semester Progress Comments Received and Actions Taken
Research Progress Research Carried out in this semester Tasks for Next Six Months
Summary of Research Work Completed (till date) Summary of Research Work Completed Papers Published / Submitted / in-Draft Conference Publications (presented/submitted/planned)
Summary of Research Work Completed (till date) Workshops/ Training Program attended IPR / Research writing workshops attended Any other value addition for your research
Slide Structure Plan for about 1.5-2 minutes per slide in your presentation Write in point form, not complete sentences, i.e., use key words and phrases Not everything needs to be presented: choose material to be put on slides Slides should be un-cluttered and use bullets where necessary
Graphs Use graphs rather than charts and words Data in graphs is easier to comprehend and retain than is raw data Trends are easier to visualize in graphical form Always title your graphs
Conclusion Use a conclusion slide to: Summarize the main points of your presentation Suggest future avenues of research
