Distribution of Employment Opportunities in India: Promoting Equal Access to Fair Work
The Indian constitution emphasizes equal opportunities in public and private employment to ensure fair wages and working conditions. Sustainable Development Goal 8 highlights the importance of decent work for all, addressing the informal employment sector prevalent in India. Inequality of opportunity framework assesses unequal access to opportunities. Human Opportunity Index (HOI) helps analyze changes in opportunity availability and distribution over time, facilitating a nuanced investigation.
Download Presentation

Please find below an Image/Link to download the presentation.
The content on the website is provided AS IS for your information and personal use only. It may not be sold, licensed, or shared on other websites without obtaining consent from the author.If you encounter any issues during the download, it is possible that the publisher has removed the file from their server.
You are allowed to download the files provided on this website for personal or commercial use, subject to the condition that they are used lawfully. All files are the property of their respective owners.
The content on the website is provided AS IS for your information and personal use only. It may not be sold, licensed, or shared on other websites without obtaining consent from the author.
E N D
Presentation Transcript
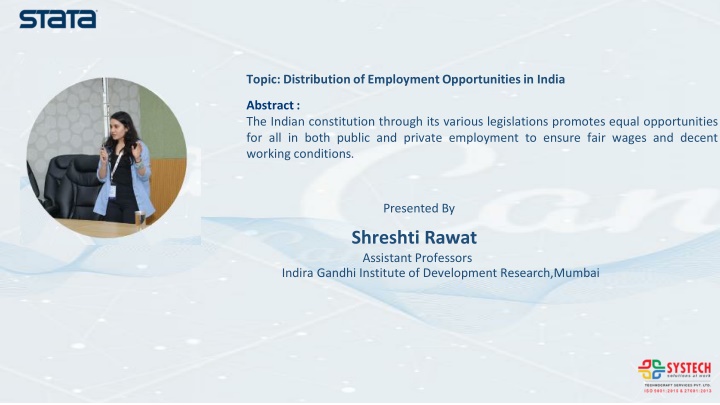
Topic: Distribution of Employment Opportunities in India Abstract : The Indian constitution through its various legislations promotes equal opportunities for all in both public and private employment to ensure fair wages and decent working conditions. Presented By Shreshti Rawat Assistant Professors Indira Gandhi Institute of Development Research,Mumbai
Distribution of Employment Opportunities in India Shreshti Rawat shreshti.rawat@meghnaddesaiacademy.org Srijit Mishra srijit@igidr.ac.in
Background Sustainable Development Goal 8: promotes decent work for all; Emphasises the importance of equal opportunities in obtaining productive work that provides fair income, social protection, and better prospects for personal development and social integration; Aims to address the decent work deficits- which are most prevalent in informal employment (ILO, 2010; Chen, 2012; ILO, 2017); Growing recognition of the need to transition towards formality (ILO, 2015); This transition is particularly crucial for India, given 85-90 % of workers are informally employed (Srivastava, 2019; Abraham, 2019); Further, presence of labour market segmentation along the lines of gender, caste, religion, and household characteristics in India (Deshpande, 2011; Jodhka & Newman, 2007; Robinson, 2008; Mohanty, 2006); This segmentation results in unequal access to formal employment opportunities for certain disadvantaged groups.
Inequality of Opportunity Such inequalities that arise due to circumstances beyond an individual's control are deemed unethical from an egalitarian perspective. Formalisation of the concept of inequality of opportunity (Roemer, 1998; Roemer, 2002). Provides a framework for assessing unequal access to opportunities. Access inequality: Human Opportunity Index (HOI) (WDR, 2006; Barros et al.,2009) Composite index that comprises of two elements: Absolute availability of basic services and goods; Inequality in distribution of these services. HOI= C(1-D) C: Coverage rate- availability of an opportunity. D: Dissimilarity amongst groups/individuals. a. i. ii. b. i. ii.
HOI Provides insights into whether a specific opportunity has improved or declined over time; Facilitates a more nuanced investigation of such changes due to the property of additive decomposability (Barros, et al., 2009; Contreras, et al., 2012; Prieto, et al., 2018; Vani & Madheswaran, 2018); Enables decomposition of changes in opportunities into two components: Changes in the availability of opportunities (Scale effect) and; Changes in the inequality of access to those opportunities (Distribution Effect). Usually applied to assess scale and distribution effect in change in opportunities for children; Scale effect greater than distribution effect in most cases, significant regional variation.
Objectives To estimate the opportunity for formal employment at national and state level; To decompose the change in opportunity of formal employment to scale and distribution effect; To identify circumstances that contribute to access inequality at state-level.
Opportunity: an individual is characterized to have an opportunity if formally employed. Methodology Individual religion, caste, region, geographical location- state zones, father s education, father s occupation, highest female education in the household. circumstances considered: gender, ? = ? 1 ? ? : Coverage rate- availability of an opportunity D : Dissimilarity amongst groups/individuals- inequality in distribution of opportunity Characteristics included: education and age of the individual- common correlates of labour market variables (Abras, et al., 2013; Khan, 2019). ? 1 ? = ?| ? ??| 2 ? ?=1 Decomposition of D-index into assess circumstance contribution using Shapley decomposition (Shorrocks, 2013). Where, k denotes a type or circumstance group, Ck: specific coverage rate of the group k, ?: share of group k in total population, m: number of disjoint circumstance groups.
Decomposition Analysis Methodological addition to decomposition in this study: Decomposition method used in studies: Following the discussions in poverty decomposition, the average of change in coverage rate is calculated keeping D- index first fixed at period i and then at period f, as follows, where ????is termed as coverage effect: ??? = ???? ????= ????+ ???? where the scale effect, ????, and the distribution effect, ????, is: ????= [ ??1 ??] [ ??1 ??] ???? 1 2 ??1 ?? ??1 ?? ??1 ?? ??1 ?? = + ????= [ ??1 ??] [ ??1 ??] Asymmetry in the treatment of base year i & terminal year f. The average of change in D-index is taken by keeping coverage rate fixed first, at period i and then at period f, as follows, where ????is termed as equality effect: ???? =1 2 ??1 ?? ??1 ?? ??1 ?? ??1 ?? +
Data India Human Development Survey (Panel) : Nationally representative, multi-topic survey conducted in 2004-05 (IHDS-I) and 2011-12 (IHDS-II). Information about each individual, their primary status activity and whether they were casual, contract or permanent workers. Individuals identified as being wage or self employment in informal and formal employment. Variable state-zone created as IHDS is not representative at state level.
Results Table 1: HOI, Dissimilarity index, and coverage for access to formal employment, formal wage employment and self-employment (Values lie between 0 and 1). HOI D-Index Coverage IHDS-I Formal Employment 0.04 0.46 0.08 Formal Wage Employment 0.07 0.48 0.14 Formal Self-Employment 0.009 0.32 0.013 IHDS-II Formal employment 0.07 0.39 0.12 Formal Wage Employment 0.11 0.44 0.19 Formal Self-Employment 0.010 0.27 0.014 Source: Author s estimates based on IHDS data
Results: Shapley Decomposition The dissimilarity index calculated is further decomposed using shapley decomposition. In the circumstances considered, while there is regional variation, highest female education in the household, father s education, region of residence of the individual contribute most to access inequality.
Results: Cont. Table 2: Decomposition of change in HOI by employment type Coverage Effect Equality Effect Access to: Change HOI in Absolute Change % contribution to Total Change Absolute Change % contribution to Total Change Formal Employment 0.03 0.023 76.71 0.009 23.29 Formal Wage Employment 0.04 0.027 77.66 0.009 22.34 Formal Self-employment 0.0022 0.001 60.64 0.001 39.77 Source: Author s estimates based on IHDS data
Results: Cont. Table 3: Decomposition of change in HOI at state zone level for formal employment Coverage Effect Equality Effect Access to Formal Change in HOI Absolute Change Percentage contribution to Total Change Absolute Change Percentage contribution to Total Change Employment: Zone 1 Northern States 0.04 0.03 75.76 0.01 24.24 Zone 2 Central States 0.03 0.02 73.89 0.01 26.11 Zone 3 Western States 0.03 0.02 83.59 0.005 16.41 Zone 4 Eastern States 0.03 0.02 73.07 0.01 26.93 Zone 5 Southern States 0.02 0.02 93.71 0.001 6.29 Zone 6 NE States Source: Author s estimates based on IHDS data -0.02 -0.002 -10.50 -0.015 -89.50
Results: Cont. Table 4: Decomposition of change in HOI at state zone level for formal wage employment Coverage Effect Equality Effect Percentage contribution to Total Change Percentage contribution to Total Change Access to Formal Change in HOI Absolute Change Absolute Change Wage employment: 0.04 0.05 0.02 0.03 0.03 -0.11 0.03 0.03 0.02 0.02 0.03 -0.08 81.40 73.40 92.35 78.01 94.62 -73.71 0.01 0.01 0.002 0.01 0.001 -0.03 18.60 26.60 7.65 21.99 5.38 -26.29 Zone 1 Northern States Zone 2 Central States Zone 3 Western States Zone 4 Eastern States Zone 5 Southern States Zone 6 NE States Source: Author s estimates based on IHDS data
Results: Cont. Table 5: Decomposition of change in HOI at state zone level for formal self-employment Coverage Effect Percentage contribution to Total Change Equality Effect Percentage contribution to Total Change Access to Formal self- employment: Absolute Change Absolute Change Change in HOI Zone 1 Northern States -0.003 0.002 0.009 0.003 -0.00001 0.001 0.001 0.006 0.001 -0.003 36.64 45.45 72.62 22.96 -200 -0.004 0.001 0.002 0.002 0.003 -136.64 54.55 27.38 77.04 100 Zone 2 Central States Zone 3 Western States Zone 4 Eastern States Zone 5 Southern States -0.004 -0.01 -150.48 0.002 50.48 Zone 6 NE States Source: Author s estimates based on IHDS data
Conclusion Low HOI for all formal employment opportunities considered, though increase between the two periods. This increase is largely driven by coverage effect at all India level. Variation observed at state zone level: Formal wage employment- increase in HOI driven by coverage effect for all state zones except NE zones, Formal self-employment- decrease in HOI for northern (equality effect ), southern (coverage effect) and NE states (coverage effect). No consistent relationship between the size and direction of coverage effect and equality effect. The magnitude of change in the HOI observed over the two time points, is not dependent on its initial level. These findings indicate that expanding opportunities' coverage is essential. However, it is equally important to ensure equitable access, taking into consideration regional disparities.
Appendix Categorical variable state-zone follows the classification of zonal councils that set up vide States Reorganization Act, 1956 (Bairwa & Sharma, 2019). Each zonal council has an advisory council that helps in economic and political cooperation among the zones. The Northern Zonal Council, comprising the States of Haryana, Himachal Pradesh, Jammu & Kashmir, Punjab, Rajasthan, National Capital Territory of Delhi and Union Territory of Chandigarh; The Central Zonal Council, comprising the States of Chhattisgarh, Uttarakhand, Uttar Pradesh and Madhya Pradesh; The Eastern Zonal Council, comprising the States of Bihar, Jharkhand, Orissa, Sikkim and West Bengal; The Western Zonal Council, comprising the States of Goa, Gujarat, Maharashtra and the Union Territories of Daman & Diu and Dadra & Nagar Haveli; The Southern Zonal Council, comprising the States of Andhra Pradesh, Karnataka, Kerala, Tamil Nadu and the Union Territory of Puducherry.
Appendix: Poverty Decomposition A change in poverty levels between period i (base year) and j (terminal year) can be decomposed into growth and inequality components. : ? is a measure of poverty which is characterised by ?, the poverty line, ? is the mean income of the population and ?(?) is the measure of inequality for income distribution ?. ? = ? ?,?,? ? The pure growth effect (???) is defined as the change in poverty if the mean income were to change but the relative income distribution measured by the inequality remains the same. Pure inequality effect (???) is defined as the change in poverty if the inequality were to change but the mean income remains the same.
Appendix: Poverty Decomposition Conti. A decomposition procedure proposed for calculating pure growth effect and pure inequality effect is as follows (Kakwani & Subbarao, 1990): ???= ? ?,??,?? ? ?,??,?? ???= ? ?,??,?? ? ?,??,?? A different formulation is also suggested to calculate the growth and inequality effect (Jain & Tendulkar, 1990): ???= ? ?,??,?? ? ?,??,?? ???= ? ?,??,?? ? ?,??,??
Appendix: Poverty Decomposition Conti. The distinction between the two formulations discussed in this context lies solely in the choice of the reference year. One formulation utilises the base year, i, while the other utilises the terminal year, j. To ensure symmetry and avoid any bias towards specific years, an alternative formulation for poverty decomposition is as follows (Kakwani, 2000): ???=1 ? ?,??,?? ? ?,??,?? + ? ?,??,?? ? ?,??,?? 2 1 2? ?,??,?? ? ?,??,?? + ? ?,??,?? ? ?,??,?? ???=
Appendix Table A1: HOI estimated for employment opportunities for state zones. Formal Employment Formal Wage Employment Formal Self-Employment 2004-05 2011-12 2004-05 2011-12 2004-05 2011-12 Zone 1 Northern States 0.07 0.12 0.14 0.18 0.02 0.01 Zone 2 Central States 0.02 0.06 0.04 0.09 0.004 0.01 Zone 3 Western States 0.06 0.08 0.10 0.12 0.005 0.01 Zone 4 Eastern States 0.03 0.06 0.07 0.09 0.004 0.01 Zone 5 Southern States 0.04 0.07 0.05 0.08 0.01 0.01 Zone 6 NE States 0.15 0.13 0.01 0.004 0.34 0.23 Source: Author s estimates based on IHDS data
Appendix: Shapley Decomposition Table A2: Percentage contribution of individual characteristics and circumstances to inequality of opportunity in access to formal employment (2004-05) Western States Eastern States Southern States NE States Northern States Central States Characteristics: Age Education Circumstances: Gender Father's Education Father's Occupation 20.67 36.70 15.04 35.39 14.12 27.50 17.94 29.70 9.85 35.72 23.60 38.11 12.41 4.52 5.43 8.90 4.50 4.67 17.21 5.21 5.82 7.74 11.07 3.51 6.75 10.05 4.65 9.46 6.99 4.09 12.59 13.04 8.72 12.90 17.74 12.75 Highest Female Education Caste Religion Region Source: Author s estimates based on IHDS data 1.11 1.51 5.07 0.43 1.46 16.57 0.12 0.66 20.63 2.06 2.44 12.63 0.17 1.90 13.16 0.44 2.05 2.52
Appendix: Shapley Decomposition Table B-2: Percentage contribution of individual characteristics and circumstances to inequality of opportunity in access to formal employment (2011-12) Western Eastern Southern NE Northern States Central States States States States States Characteristics: 7.34 6.83 5.82 6.54 1.62 11.03 Age 36.68 34.62 33.89 40.12 44.83 47.35 Education Circumstances: Gender Father's Education Father's Occupation 13.77 7.91 3.14 7.31 7.46 3.51 14.48 6.21 2.83 7.45 11.13 4.31 7.43 11.87 3.51 5.88 7.95 4.94 15.20 14.61 10.51 17.69 18.45 14.45 Highest Female Education Caste Religion Region Source: Author s estimates based on IHDS data 1.22 2.38 12.37 0.65 1.29 23.72 1.43 1.30 23.55 0.31 0.28 12.16 0.70 0.59 11.00 2.14 1.11 5.15
