Detailed Review of R-Alice PDS Data - Southwest Research Institute
Content discusses the R-Alice PDS data review conducted by Cesare Grava from Southwest Research Institute. It includes details on FUV imaging spectrograph specs, objectives of R-Alice, study goals related to comet nucleus, atomic budget analysis, and spectral mapping of 67P/CG nucleus at FUV wavelengths. Ancillary data documents are provided to aid in understanding data processing and conversion methods for brightness into column density to derive production rates.
Download Presentation

Please find below an Image/Link to download the presentation.
The content on the website is provided AS IS for your information and personal use only. It may not be sold, licensed, or shared on other websites without obtaining consent from the author.If you encounter any issues during the download, it is possible that the publisher has removed the file from their server.
You are allowed to download the files provided on this website for personal or commercial use, subject to the condition that they are used lawfully. All files are the property of their respective owners.
The content on the website is provided AS IS for your information and personal use only. It may not be sold, licensed, or shared on other websites without obtaining consent from the author.
E N D
Presentation Transcript
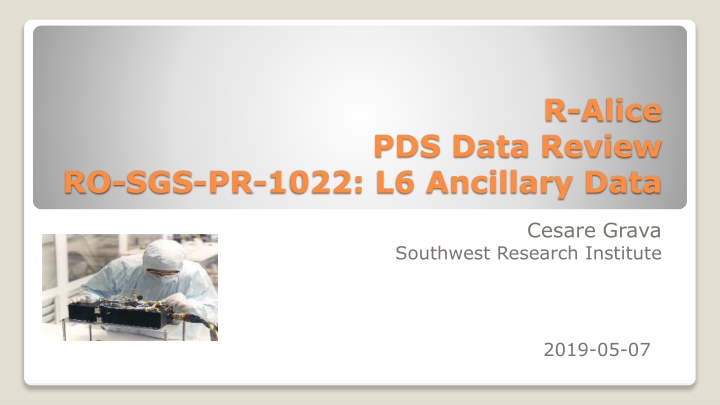
R-Alice PDS Data Review RO-SGS-PR-1022: L6 Ancillary Data Cesare Grava Southwest Research Institute 2019-05-07
FUV imaging spectrograph Spectral Range 700 - 2050 Spectral Resolution 12.5 - 9.8 for extended sources Slit length: 6 Nominal Effective Area 0.03cm2 (at 1900 ), to 0.53cm2 (at 1150 ) Three modes of operation: Pixel list mode: preserves time information; Histogram: 2D histogram of previous; Count rate: no spectral or spatial information is provided. You can create a histogram from pixel list but not vice versa Very similar to the LRO/LAMP UV spectrograph I work with. R-Alice Specs
Stern et al., 2007 Sp. Sci. Rev. R-Alice s scheme
Search for and determine the evolved rare gas content of the nucleus to provide information on the temperature of formation and thermal history of the comet since its formation. Determine the production rates of the parent molecule species, H2O, CO and CO2, and their spatial distributions near the nucleus, thereby allowing the nucleus/coma coupling to be directly observed and measured on many timescales. Study the atomic budget of C, H, O, N, and S in the coma as a function of time. Study the onset of nuclear activity in ways Rosetta otherwise cannot. Spectral mapping of the entire nucleus of 67P/CG at FUV wavelengths in order to both characterize the distribution of UV absorbers on the surface, and to map the FUV photometric properties of the nucleus. Study the photometric and spectrophotometric properties of small grains in the coma as an aid to understanding their size distribution and how they vary in time. Map the spatial and temporal variability of O+, N+, S+ and C+ emissions in the coma and ion tail in order to connect nuclear activity to changes in tail morphology and structure near perihelion. 1. 2. 3. 4. 5. 6. 7. Objectives of R-Alice
Dogbone-shaped slit Feldman et al., 2018 Astron. J. R-Alice slit Stern et al., 2007 Sp. Sci. Rev.
L6 Ancillary data These are documents to help the user understand how the data were taken and how to convert brightness in column density (to get e.g. production rates). Documents cover the 3 main phases of the mission, from the prelanding phase (PRL, 2014-02-23) through the escort phase (ESC, main mission timeframe, starting 5 days after Philae landing, on 2014-11-12) and until the extended mission (EXT, ending on 2016-09-30). Datasets Reviewed
.pdf file describes the modes of operation of Alice, its scientific goals, and how it interacted with the other instruments of Rosetta. Really well written. .lbl file describes the above-mentioned document Rosetta_alice_encounter_operations
.txt file contains a list of all the observations (including calibration and failed ones) from shortly after beginning of PRL phase to the end of the mission Major RID: include name of the file for the exposures (the X ones), like it s done for the NavCam images. This will allow the users to immediately find the file they are looking for. .lbl file describes the above-mentioned document Ra_logbook_escort_2017-02-10
.TAB contains g-factors for relevant emission sources at 100K for the duration of the Rosetta mission comet escort phase: NeI, NII, ArI, OI, CII, SI, CI, CO4PG, N2, H2 Necessary to convert brightness into column density for species that emit via resonant scattering of solar photons. Major RID: why are g-factors often discrete ? The dates are not: they are separated by 1 day. So g-factors should not be equal over multiple consecutive days. .lbl file describes the above-mentioned document G_FACTOR_DAILY_DATA
.TAB contains parameters relative to the Chameleon feature Highly variable Noonan et al., 2016 Acta Astr. uv_feature_data
.TAB contains parameters relative to the Chameleon feature Major RID: start times are actually later than mid-times. .lbl file describes the above-mentioned document uv_feature_data
Could you state over which rows the Chameleon count rate (6th column of uv_feature_data.lbl) has been computed? Also, it would be good to add the names of the .fits files corresponding to the rows in uv_feature_data.lbl Post-RID comments (May 7th)
