Deciphering the Role of Statistics in Research and Critical Appraisal
Understanding the essence of statistics in research, this content explores the significance of statistics in describing variations, predicting outcomes, and controlling variables. It emphasizes the distinction between single-concept and relationship-based research questions, and warns against misinterpreting statistical data as causation without proper experimental design.
Uploaded on Jul 19, 2024 | 1 Views
Download Presentation

Please find below an Image/Link to download the presentation.
The content on the website is provided AS IS for your information and personal use only. It may not be sold, licensed, or shared on other websites without obtaining consent from the author.If you encounter any issues during the download, it is possible that the publisher has removed the file from their server.
You are allowed to download the files provided on this website for personal or commercial use, subject to the condition that they are used lawfully. All files are the property of their respective owners.
The content on the website is provided AS IS for your information and personal use only. It may not be sold, licensed, or shared on other websites without obtaining consent from the author.
E N D
Presentation Transcript
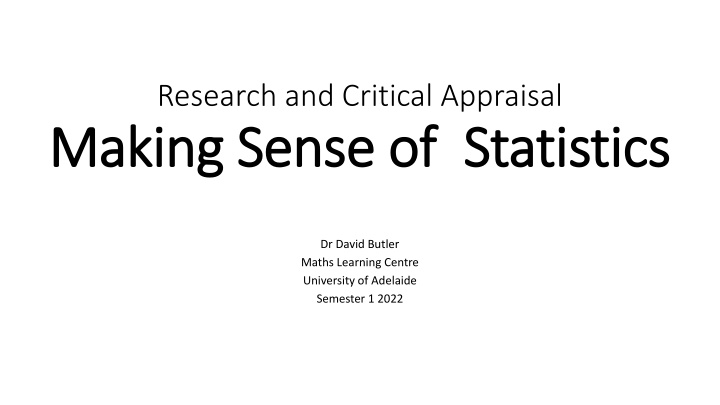
Research and Critical Appraisal Making Sense of Statistics Making Sense of Statistics Dr David Butler Maths Learning Centre University of Adelaide Semester 1 2022
You NEED statistics because things VARY You want to: describe how things vary figure out what is usual predict the variation control the variation
Statistics is for answering questions using data When you do statistics, you use the data to: draw graphs calculate numbers perform statistical tests create mathematical formulas for predicting things
Some research questions are about a single concept For example: How much salt is there in an avocado? What percentage of people experience joint pain? How much cloud cover does Adelaide have in March? Do the majority of ice-creams have the amount of fat in them that the nutrition information says?
MOST research questions are about the relationship between concepts For example: Are science fiction books thicker than other books? How much of an effect does more sleep have on a student s grades? Does chilli in a meal make a difference to your body temperature? How can you predict the air temperature from the amount of cloud cover?
WARNING! WARNING! Statistical calculations by themselves NEVER tell you whether anything CAUSES anything else. (That s what experimental design is for.)
For statistics to help, you have to turn concepts concepts into variables variables by measuring them For example, in the question Does chilli in a meal make a difference to your body temperature? , chilli could be measured as: Whether a meal has chilli in it or not. The classification of the meal as mild, medium or hot. The exact amount of chilli powder added to the meal during cooking. YOU HAVE TO DECIDE HOW YOU MEASURE
WARNING WARNING! ! Statistical calculations by themselves NEVER tell you whether anything CAUSES anything else. (That s what experimental design is for.) BUT BUT Statistics CAN help you CALCULATE what you expect one variable to be, from other variables. Outcome variable Explanatory variable
Where weve been Research questions are about concepts and the relationships between them. Concepts become variables when you measure them. Statistics questions are about variables and the relationships between them. Statistics can help you calculate one variable from others, but not decide if one thing causes another. Where we re going What stats you do depends on: What type of question you re asking Information about the variables
Types of statistical question and the stats that go with them Purpose Describe Type of question What s going on? Type of statistics Descriptive statistics: graphs, percentages, means, correlations Hypothesis testing: test statistics and p- values Confidence intervals Decide Yes or no? Estimate What s the number? What s the formula? Predict Modelling: regression
Hypothesis tests help decide answers to yes-or-no questions How people create hypothesis tests Official name Imagine a world where one of the answers is true whichever answer has only one way to be. Choose a calculation where you can know all the answers that could be and how likely they all are. Null hypothesis Test statistic Think about how likely the test statistic you got from your data is, compared to all the answers it could have been. Choose a cutoff where you will say a p-value counts as low. P-value Significance level If the p-value is low, your data is unlikely in the null hypothesis world, so you don t believe you live in that world. If the p-value is high, your data is likely in the null hypothesis world, so you do believe you might live in that world.
Information about the variables changes the statistical calculations you can do
Two kinds of variables CATEGORICAL (also known as qualitative ) Words: how far apart has no meaning. NUMERICAL (also known as quantitative , interval , scale ) Numbers: how far apart has meaning.
Categorical variables belong to subjects in different ways Repeated measures Independent groups
Distribution of numerical variables The distribution of a variable is all the things it can possibly be and how likely all those options are. not normal approximately normal more likely in the middle less likely on either side just as likely one side as the other
Information about the variables changes the statistical calculations you can do How many variables are involved What kind of variables they are Categorical variables whether there are two categories or more than two Categorical explanatory variables whether they go with independent groups or repeated measures Numerical outcome variables whether the distribution is normal (probably doesn t matter if sample size is large)
ANOVA (ANalysis Of VAriance)
(Simple) Regression Note: technically answers a predict question, but produces hypothesis tests along the way
Multiple Regression Note: technically answers a predict question, but produces hypothesis tests along the way
Multiple Regression Note: technically answers a predict question, but produces hypothesis tests along the way
One sample t-test Note: helps to answer the question of whether the mean is equal to a specific number.
One sample z-test for a proportion Note: helps to answer the question of whether the proportion of people in one category is equal to a specific number.


