Cost Rationalization in Power & Energy Supply with Renewable Energy Promotion
Presenting the current status of the power sector in Bangladesh, focusing on factors such as installed capacity, ownership breakdown, fuel mix, capacity addition over the years, and the energy sector related to gas production. The presentation explores opportunities for cost rationalization, energy supply optimization, and promoting renewable energy sources for a sustainable future.
Download Presentation

Please find below an Image/Link to download the presentation.
The content on the website is provided AS IS for your information and personal use only. It may not be sold, licensed, or shared on other websites without obtaining consent from the author. Download presentation by click this link. If you encounter any issues during the download, it is possible that the publisher has removed the file from their server.
E N D
Presentation Transcript
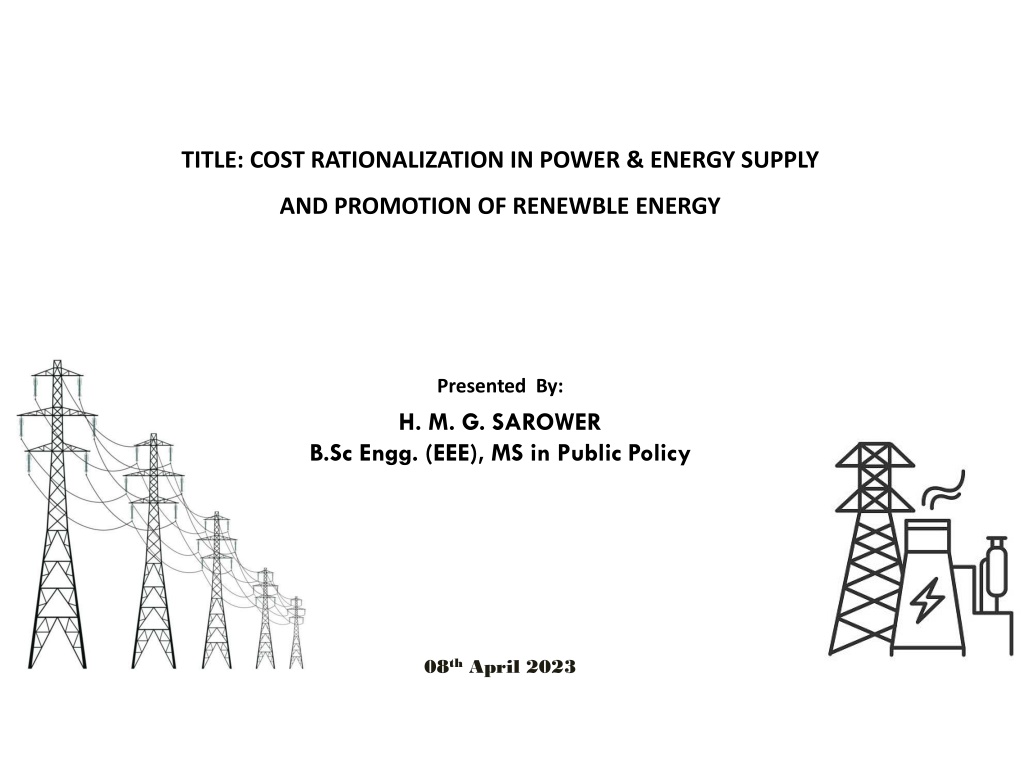
TITLE: COST RATIONALIZATION IN POWER & ENERGY SUPPLY AND PROMOTION OF RENEWBLE ENERGY Presented By: H. M. G. SAROWER B.Sc Engg. (EEE), MS in Public Policy 08th April 2023
Present Status of Bangladesh Power Sector. 26700 MW 153 No s 100% 44.6 Million 608.76KWh Number of Consumer Number of Power Plants Installed Capacity Access to Electricity Per-Capita Generation Inclueding Captive and Renewbles Gas based-62 Liquied Fuel HFO/HSD 74 Coal 06 Hydro-01 Solar 10 SLIDESMANIA.COM Grid Connected Present Cpacity 22700) Maximum Generation 14782 MW 2
Present Status of Bangladesh Power Sector(Cont..) (Installed Capacity). Installed Capacity( Ownership) Installed Capacity (Ownership wise) 8000 Power Import 5% 7000 Joint Venture 6% 6000 11585 MW INS CAPACITY MW 5000 4000 Total Public Sector 50% 3000 1399 MW Total Private Sector 39% Import 8884MW 2000 1160 MW 1000 0 Tripura 3/5 Year Bheramara EGCB NWPGCL BCFPCL BIFPCL RPCL SIPP(BREB) APSCL SIPP(BPDB B-R Ppwer 15 Y Rental IPP BPDB OWNERSHIP
Present Status of Power Sector (Cont) Installed Capacity( According to Fuel Mix) Fuel Wise Installed Capacity of Power Sector Import 5% HSD 6% Coal 12% HFO 32% Gas 43% RE 1% Hydro 1% Source: PGCB Daily Gen Report Source:8th Five Year Plan
Present Status of Bangladesh Power Sector(Cont..) Capcity Addition Year Wise Capacity Addition MW Capacity Addition by Public Sector in MW Capacity Addition by Private Sector in MW Year Total in MW 3500 2010 2011 2012 2013 2014 2015 2016 2017 2018 2019 2020 2021 2022 255 800 607 587 68 560 775 967 1349 814 709 1709 749 775 963 344 576 567 797 370 220 2914 1590 438 859 575 1030 1763 951 1163 635 1357 1145 1187 4263 2404 1147 2568 1324 3000 2500 2000 1500 1000 500 0 Public sector Addition in MW Private sector Addition in MW
Current Status of Bangladesh Energy Sector(GAS) Total number of gas fields Number of gas fields in production Number of producing wells Present gas production capacity 26 No's 20 No's 112 2750 MMcfd 1744--2750 MMcfd Domestic gas Exploration Capacity(MMcfd) Tullow 56.68 1405.85 Avg. gas production rate Chevron Avg. Gas Production/day Total recoverable ( Proven + Probable ) reserve Remaining Recoverable Reserve Present Demand 2978 MMcfd 40.09 Tcf 9.06 Tcf 3508 MMcfd 530 MMcfd (along with LNG) 43 Lakh (Appx. SGFL 88.67 BGFCL 618.8 Gas BAPEX 136.84 Present Deficit Number of Customer Company wise gas production In Bangladesh BAPEX (MMcfd) BGFCL (MMcfd) SGFL (MMcfd) Chevron (MMcfd) Tullow (MMcfd) Year of Production 2021-22 136.84 618.8 88.67 1405.84 2306.83
Current Status of Bangladesh Energy Sector(GAS) LNG import Scenerio: 10 year LNG sale and Purchase Agreement SPA Petro Bangla Qatar gas /Ras Laffan Liquefied Natural Gas Co Ltd (Ras gas ) 2.5 Million Metric Ton Petro Bangla -Oman trading international( ager OTI) OQ Trading = 1.5 Million Metric Ton Spot market Master Sales Purchase Agreement(MSA)-16 companies . IOC + National Gas company 24143 Million Cubic Meter/Year(domestic) Imported LNG 7078.29 ( Qatar=4036.66) +OQ (2005.41) Million Cubic Meter Spot Market 1036.44 Million Cubic Meter Total 31221.71 million Cubic meter ( Demand 36262 Ml.cm)
Current Status of Bangladesh Energy Sector(Petroleum) Yearly petroleum Demand 73 Lac MT 69.15 Lac MT(2021-22 Total Country Consumption) 8% Domestic Sources 92% Import Consumtion of Petrolium 2021-22 1%5% Transport 2% 13% Agriculture Power Domestic 17% Industry 62% Others
Current Status of Bangladesh Energy Sector(Coal) Coal Reserves-322,976,830 Tones. Coal Production 995,386 Tones/Year Coal Consumption-2099900 Tones.
Challenges??Weaker link? Trouble???Tension?? Tariff Increased 12 Times in last 10 Years( at Consumer Level) 207% increase. Load shedding in last summer due to Fuel crisis. Vulnerable to global Supply chain disruption and Price volatility. Fiscal Deficit/Budgetary Transfer-Burden to economy.
Examine the Rationality of Cost Increase of electricity: Power Pricing Framework (Approved by the Government in January 2004) Tariff-Cost reflecting( Generation +Service +T&D+ Surplus) Subsidized energy for Underprivileged. Regular adjustment. Two part tariff(Capacity payment +Energy Payment) Methodology( Tariff) Overall tariff rate( Consumer): Fuel Cost Recovery rate X Total Energy for Transmission in KWh)+ Service Rate X Total for Transmission in KWH) Service rate= Recommended Revenue requirement/ Net Energy Generation) Revenue requirement= Return on Rate base+ Expenditure.
Approach to Examine the cost(increase) rationalization Cont . Back in 2007-08 27 No s Power plant (19 public +8 Private) Public Generation 62.41% public and private 33.59% Total= ( 24314mKWh) Revenue deficit =657 Cr BDT 2021-2022 153 (86 private) 2021-22 public 37% + Joint Venture 4.6% IPP+RPP 48.88% Import 9% 85607MKWh, Revenue Deficit = 27000 crore
Approach to Examine the cost(increase) rationalization Cont. Average Cost(BD/KWh) 4.6 3.59 3.48 6.51 16.23 19.38 13.83 10.22 7.34 6.06 Unit (MKWh) 16957 7067 3821 4972 674 410 4015 35645 3133 7466 Cost Gen-Utility/Co. % % (Million BDT) 78067 25393 13305 32369 10936 7945 55529 364621 23003 45214 BPDBs Generation APSCL EGCB NWPGCL RPCL B-R Power BCFPCL(Payra) IPP+SIPP RPP+QRPP Import from INDIA Total Purchase and Import Cost of electricity (2021-22) 20% 8% 5% 6% 1% 0.5% 5% 42% 4% 9% 12% 4% 2% 5% 2% 1% 8% 56% 4% 7% 84160 656382
Approach to Examine the cost(increase) rationalization Cont. Comparison: Supply cost of electrify with bulk sales tariff COMPARISON WITH PER UNIT SUPPLY COST OF IPP, RPP AND IMPORT TO BULK SELLING TARIFF Per Unit Cost of IPP Per Unit Cost of RPP Per Unit Cost of Import Average Bulk selling Tariff 12 10 8 6 4 2 0 2009- 10 2010- 11 2011- 12 2012- 13 2013- 14 2014- 15 2015- 16 2016- 17 2017- 18 2018- 19 2019- 20 2020- 21 Year Wise Operating Expenses to operating revenue 71857 50435 39587 39553 36812 29873 26683 26402 24479 21396 18131 12276 44321 7512 41770 35535 34507 30604 28295 25322 21188 19429 16883 12001 Budgetary Transfer 8161 7116 2009-102010-112011-122012-132013-142014-152015-162016-172017-182018-192019-202020-212021-22 Total Revenue (Crore Tk) Operating Expense ( Crore Tk)
Approach to Examine the cost(increase) rationalization Cont . 1. Almost 80% of Peak load power plant belong to Private. 2. Among 86 no s Private plant -50 of them HFO/HSD 3. Peaking power plants on baseload operation . 4. Underutilization and payment.( Capacity added @12% , actual generation increased @7%). 5. Delayed Retirement of Contractually Expired RPPs . 6. Time and Cost overruns of public Power Projects .
Context of Private Power of Bangladesh Phase-01 Global Influence in 90 s Phase-02 Severe Electricty Crisis (2006-08) Acute Shortage of electricity in developing No significant capacity added (2001-2006) countries WORLD BANK Policy Transfer Abysmal power Crisis loomed in 2006-2008 Structural and sectoral reform Government committed to deal with this crisis Corporatization Two Pronged Strategy : Regulation, Deal with immediate electricity Crisis Competitiveness- Development plan as BAU (in view of Involving Private Sector Developed country by 2041) Key Factor for Reform Drive PSMP - capacity Addition Plan 24 GW 2021 to 40 GW 2030 and 60 GW at 2041 Requirement of huge CAPEX can no be borne by government alone Engage Private Sector Monopolistic State utility is inefficient Unavailability of Public Funds for Capacity Development 1996-2008 ( 8 no's Private Plant) , 2009-2023( 78 Private plant )
Private power Engagement network of Bangladesh Parallel policy for same purpose PPP Act. 2015 Policy Guide lines for Enhancement of Private Participation in Power Sector PSE in electricity Generation No Strategic Linkage PPA-2006, PPR-2008 ( Standard Bid Documents) Competitive Engagement PSPGPOB 1996 Non competitive Engagement Special Act 2010 Power cell as Single window operation Standard Security Package Documents PPA, LLA, IA, GSA, FSA Investment Incentives Competitive Bidding No requirement for RFQ and RFP Bid Documents RFQ+RFP BPDB Single window operation Unsolicited tariff will be equal or lower than previous a tariff 1. Policy limitation and ambiguity 2. Expedient take from multiple policy sources by the policy implementers which can be called arbitrary Practice. 3. No effective Competition ( 48+ Out of 78 non competitive ).
List of Relevant Policy, Act, Law etc. for PSE in Bangladesh. Private Sector Power generation Policy Policy Guidelines for Small Power Plant (SPP) In Private Sector PPP Act.-2015 Bangladesh Energy Regulatory Commission (BERC) Act Procurement Guideline for PPP Projects, 2016 Private Sector Infrastructure Guidelines. Policy Guidelines for Enhancement of Private Participation in Power Sector The Policy and Strategy for Public-Private Partnership Quick Enhancement of Electricity and Energy Supply (Special Provisions) Act, 2010 1996/2004 Guidelines for Unsolicited Proposals, 2016* ( PPP Policy) 1998/2008 2003 Rules for VGF Financing for PPP Projects, 2018 2004 2008 Amended 2023 2010 2010 2015 SLIDESMANIA.COM
Private power Engagement network of Bangladesh Flaws lead to cost increase Policy Arrangement of PSE : Quick enhancement of energy and electricity special act -2010 PSPGPOB 1996 has no involvement of act, Provision of PSE without competitive bidding rules or law to regulate policy deviations. Stripping or discontinuation of this Act. will create PSPGPOB 1996 has multipole limitation. immediate policy void in power sector. Not strategically linked with PPR-2008 Indulges policy broadness and vagueness. Unclear procurement guideline No provision for unsolicited proposal Sanctity of individual has been taken for granted. PSE procedures has Expedient take from multiple policy Against the spirit of public procurement by ensuring competition, transparency, accountability economy, sources (Arbitrary and Expedient Practice). efficiency. Avoidance of parallel policy arrangement The PPP Act 2015
Payment Structure for IPPS : Payment Structure Return on Equity Fixed Cost Principal Interest Reserve Accounts Guaranteed by Government regardless of plant operation Capacity Payment On Private company Variable O&M Cost Fuel Cost Energy Payment Guaranteed by Government when plant operation SRO -05 & -04 : Exempted private power companies from the taxes payable as per Bangladesh Income Tax Ordinance -1985 Fiscal Incentives SRO -73 :Exemption of Import Duty (ID), Value Added Tax (VAT), Supplementary Duty(SD), and Advance Income Tax for plant Machinery import .
Risk Distribution Risk Allocation: Implementation Risk, Market Risk and operational Risk. Private Sector Public Sector Market Risk Implementation Risk Operational Risk Cost Overruns Currency Devaluation Electricity Demand Fuel Price Inflation O & M cost Time Overrun Overruns Completion Force Majeure Force Majeure Project Implementation Risk is borne by the private investor or SPV. 80% of liquid fuel based power plant is owned by IPPS, which have relatively lower gestation period, and lower investment. Reduces implementation Transfer EPC contractor, Insurance, OEM). Performance Majority of Market risk is attributed to government. Study finding regarding few market related risk discussed as bellows, risk (
Irrational Cost Increase of Electricity: Risk association with existing policies on present mode of PSE in electricity generation of Bangladesh Supply Cost increases in IPP+RPP+IMPORT. 01 02 Cost Implication due to Underutilization of Installed Capacity pass through in tariff. Existing policy arraignment used fro PSE has multiple policy limitation. Inefficient utilization Liquid Fuel Based Private Power plant 04 03 Inactivity of Domestic fuel/RE Harness Risk of bad execution and cost implication . 06 05 Delayed Retirement of Expired RPPS Limit Effective Competition Majority of Market risk to the public sector Unsolicited engagement submissive to Crisis and negotiation environment.
Why to scale-UP RE?? 11.47 TCF of natural gas reserves remaining, with of 0.97 TCF in 2018, indigenous gas reserves will annual production only last up to 2026. Local production can only meet 5 percent of the total energy demand. Therefore, Bangladesh s current trajectory with respect to future generation capacity likely to be Externally dependent . Coal import , LNG import Energy security in danger. Increase Demand, Retirement Schedule 2030=8000 MW. Global commitments(6.3% and 15.12%) for GHG emissions reductions and decarburization (40% power generation form clean energy by 2041) Fossil Fuel, cost increasing and source decaling .
Renewable Energy Prospect and perspective in Bangladesh: Renewable Energy Installed Capacity 966.48 MW Off-Grid (MW) 356.86 2 0 0.69 0.4 359.95 On-Grid (MW) 375.63 0.9 230 0 0 606.53 Technology/Type (MW) SOLAR WIND HYDRO BIO-GAS BIOMASS 732.49 2.9 230 0.69 0.4 966.48 Grid-connected solar PV potential is 50000 MW.(USAID) National Renewable Energy Laboratory (NREL)Study- Gross wind potential of over 30000 MW.
Cost Competitiveness: of RE in Bangladesh The price of solar power has fallen by over 80% since 2010 Between 2010 and 2021, the global weighted average LCOE of newly commissioned offshore wind projects declined from USD 0.188/kWh to USD 0.075/kWh, a reduction of 60%. Unit Supply Cost of Electricity 2022-23 Cost of Solar in Bangladsh Cost of Wind in Bangladesh 9.48 BDT/KWh 9.99 Cents/KWh 13.20 Cents/KWh Cost of Solar in INDIA Cost of Wind Power in INDIA 3.2 Rs/KWh Rs 3/KWh SO RE is Already Cost competitive . Reduced to 1.9-2.6 by 2030 Reduced to 2.3-2.6 by 2030
Off Tract RE requires big push. 10 percent of electricity demand to be met by 2020 (Renewable Energy Policy 2008) Revisiting PSMP 2016 10% share by capacity 2,630( 2020) 5,307(2030) 7,950(2041) SDG Goal-7 Indicators 7.1.1: Proportion of population with access to electricity Indicators NPT 20: Increase renewable energy share in total final energy consumption to 10% (SDG Indicator 7.2.1)-2030. Real big push is required for sustainable energy transition to RE, cause RE will ensure energy securty.
Any Question? Thank You
