Comparison of GLM-16 and GLM-17 with WWLLN Strokes
The report by Robert Holzworth and Michael McCarthy discusses the comparison of GLM-16 and GLM-17 with WWLLN strokes, highlighting areas of agreement and disagreement. Methods for matching GLM and WWLLN events are explored, focusing on time and distance considerations. The analysis shows that NOAA-16 and 17 match WWLLN stroke locations at similar rates, but GLM-16 still exhibits areas of disagreement. The report delves into various issues found in the present files and provides insights into the matching process. Errors in matching GLM-16 and WWLLN strokes are identified, presenting contrasting visualizations of the data for analysis. The report concludes with a comparison of GLM-16 and GLM-17 flashes, shedding light on the matched WWLLN events for both models.
Download Presentation

Please find below an Image/Link to download the presentation.
The content on the website is provided AS IS for your information and personal use only. It may not be sold, licensed, or shared on other websites without obtaining consent from the author.If you encounter any issues during the download, it is possible that the publisher has removed the file from their server.
You are allowed to download the files provided on this website for personal or commercial use, subject to the condition that they are used lawfully. All files are the property of their respective owners.
The content on the website is provided AS IS for your information and personal use only. It may not be sold, licensed, or shared on other websites without obtaining consent from the author.
E N D
Presentation Transcript
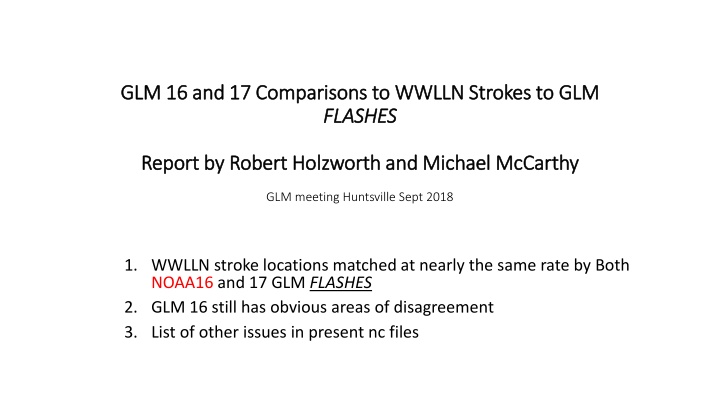
GLM 16 and 17 Comparisons to WWLLN Strokes to GLM GLM 16 and 17 Comparisons to WWLLN Strokes to GLM FLASHES FLASHES Report by Robert Holzworth and Michael McCarthy Report by Robert Holzworth and Michael McCarthy GLM meeting Huntsville Sept 2018 1. WWLLN stroke locations matched at nearly the same rate by Both NOAA16 and 17 GLM FLASHES 2. GLM 16 still has obvious areas of disagreement 3. List of other issues in present nc files
Discussion of Methods for Matching GLM and WWLLN events WWLLN stroke times can be several msec prior to the GLM Flash time, and up to 3000 ms after the flash time. TIME: See Next Slide We used 200 ms before flash start, to 200 ms after flash end And within 100 km Distance- see following slide
GLM16 GLM17
ALL WWLLN strokes (blue) over plotted with GOES16 GLM Matches
ERRORS GLM WWLLN LEFT: same as earlier slide (all WWLLN (blue) over plotted with Matches) RIGHT: JUST THE OPPOSITE: ALL GLM-16 (red) over plotted with Matches
ALL FLASHES GOES16 And GOES17 FLIP with next slide ALL GLM17 flashes (black) plotted on top of ALL GLM16 (red) flashes
ALL GLM16 flashes (red) plotted on top of all GLM17 flashes (black)
WWLLN GLM17 MATCHED WWLLN GLM16 MATCHED
Other notes from Michael McCarthy: 1. Fill value is sometimes used in the file time stamp. Sometimes a series of files each have time stamp with the fill value (-999). Excepting the last file in the series, each has no {event,group,flash} data. Is data in the last file good even though the time stamp is fill? Example from day 09Jul2018/GOES16: OR_GLM-L2-LCFA_G16_s20181901547200_e20181901547200_c20181901548106.nc OR_GLM-L2-LCFA_G16_s20181901547400_e20181901547400_c20181901548305.nc OR_GLM-L2-LCFA_G16_s20181901548000_e20181901548000_c20181901548505.nc OR_GLM-L2-LCFA_G16_s20181901548200_e20181901548200_c20181901549105.nc OR_GLM-L2-LCFA_G16_s20181901548400_e20181901548400_c20181901549305.nc OR_GLM-L2-LCFA_G16_s20181901549000_e20181901549000_c20181901549506.nc OR_GLM-L2-LCFA_G16_s20181901549200_e20181901549200_c20181901550105.nc OR_GLM-L2-LCFA_G16_s20181901549400_e20181901549400_c20181901550304.nc Each has time stamp -999. Except the last file, each has no {event,group,flash} data. Last file has 2369 events, 772 groups, 27 flashes. Same thing happened on 3 days in July 2018 for GOES16. 2. Conflicting/incorrect count values in .nc files This problem was discussed some at last year's meeting, and is not new. Over July 2018, GOES16/GLM had 132,286 20-second L2 files. Discrepancies between the claimed and actual number of (events,groups,flashes) in a file appeared in (28, 27, 116) files for events, groups, and flashes respectively. For example, the file starting 10Jul2018 at 21:11:40 has 536 events, although the event count field in the .nc file indicates there should be 10264 events. Oddly, there is data for 563 flashes, implying several flashes have zero events. 3. I don't think we pursued the problem shown in the flashDurations figure. The distribution of flash durations shows artifacts at 0s, near 0.2s, and after 3.0s. 4. I attached a figure associated with some WWLLN strokes appearing before a flash is detected, and the brief write-up that I uploaded last March.
