Comparison of Annual Wage and Benefit Scenarios for Single Parent with Two Children
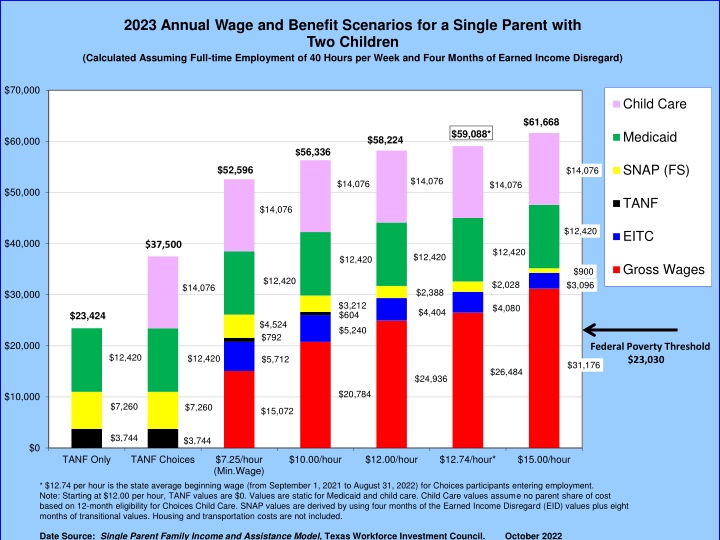
Annual wage and benefit scenarios for a single parent with two children in 2019 and 2023, considering full-time employment with four months of earned income disregard. The analysis includes child care costs, Medicaid, SNAP (FS), TANF, EITC, gross wages, and federal poverty thresholds. Trends in wages and benefits over the years are highlighted.
Download Presentation

Please find below an Image/Link to download the presentation.
The content on the website is provided AS IS for your information and personal use only. It may not be sold, licensed, or shared on other websites without obtaining consent from the author.If you encounter any issues during the download, it is possible that the publisher has removed the file from their server.
You are allowed to download the files provided on this website for personal or commercial use, subject to the condition that they are used lawfully. All files are the property of their respective owners.
The content on the website is provided AS IS for your information and personal use only. It may not be sold, licensed, or shared on other websites without obtaining consent from the author.
E N D
Presentation Transcript
2023 Annual Wage and Benefit Scenarios for a Single Parent with Two Children (Calculated Assuming Full-time Employment of 40 Hours per Week and Four Months of Earned Income Disregard) 2019 Annual Wage and Benefit Scenarios for a Single Parent with Two Children (Calculated Assuming Full-time Employment of 40 Hours per Week and Four Months of Earned Income Disregard) 50000 $70,000 Child Care Child Care $46,616 $45,948 $61,668 $0 $45,172* 45000 $60,000 $43,396 Medicaid $42,668 $59,088* Medicaid $58,224 $7,468 $7,412 $7,596 $56,336 SNAP (FS) SNAP (FS) $7,876 40000 $7,980 $52,596 $14,076 $14,076 $14,076 TANF $14,076 $50,000 35000 TANF $14,076 $10,860 EITC $10,860 $10,860 $12,420 $10,860 EITC 30000 $40,000 Gross Wages $10,860 $37,500 $1,548 $12,420 $12,420 $12,420 $2,056 $0 Gross Wages $444 $2,660 $900 $1,860 25000 $12,420 $512 $2,260 $2,028 $3,096 $3,820 $20,388 $14,076 $2,676 $2,388 $4,168 $30,000 $652 $3,212 20000 $4,080 $4,404 $604 $23,424 $704 Federal Poverty Threshold $20,780 $3,556 $4,524 $5,240 $3,884 $10,860 $792 15000 $20,000 Federal Poverty Threshold $23,030 $24,936 $12,420 $12,420 $5,712 $22,860 $26,484 $31,176 $20,868 $24,936 10000 $10,000 $15,072 $20,784 $16,632 $6,048 $7,260 $7,260 $15,072 5000 $3,744 $3,480 $3,744 $0 0 TANF Only TANF Choices $7.25/hour (Min.Wage) $10.00/hour $12.00/hour $12.74/hour* $15.00/hour TANF Only $7.25/hour (Min.Wage) $8.00/hour $10.04/hour* $11.00/hour $12.00/hour * $10.31 per hour is the state average beginning wage (from September 1, 2017 to August 31, 2018) for Choices participants entering employment. Note: At $12.00 per hour, TANF values are $0. Annual values are derived by using four months of the Earned Income Disregard (EID) values plus eight months of Transitional values. Housing and Transportation costs are not included. based on 12-month eligibility for Choices Child Care. SNAP values are derived by using four months of the Earned Income Disregard (EID) values plus eight months of transitional values. Housing and transportation costs are not included. * $12.74 per hour is the state average beginning wage (from September 1, 2021 to August 31, 2022) for Choices participants entering employment. Note: Starting at $12.00 per hour, TANF values are $0. Values are static for Medicaid and child care. Child Care values assume no parent share of cost Date Source: Single Parent Family Income and Assistance Model, Texas Workforce Investment Council. January 2019 Date Source: Single Parent Family Income and Assistance Model, Texas Workforce Investment Council. October 2022
2023 Monthly Wage and Benefit Scenarios for a Single Parent with Two Children (Calculated Assuming Full-time Employment of 40 Hours per Week. Monthly Values based on Transitional Benefits) $5,139 Child Care $4,924* $5,000 $4,852 Medicaid $4,663 $1,173 $4,337 SNAP (FS) $1,173 $1,173 $1,173 $4,000 TANF $1,173 EITC $1,035 $3,125 $1,035 Gross Wages $3,000 $1,035 $75 $1,035 $1,035 $258 $169 $1,173 $199 $1,952 $340 $283 $367 $2,000 $440 $397 $476 Federal Poverty Threshold $1,919 $1,035 $1,035 $2,207 $2,598 $1,000 $2,078 $1,732 $605 $1,256 $605 $312 $312 $0 TANF Only TANF Choices $7.25/hour (Min.Wage) $10.00/hour $12.00/hour $12.74/hour* $15.00/hour * $12.74 per hour is the state average beginning wage (from September 1, 2021 to August 31, 2022) for Choices participants entering employment. Note: Starting at $7.25 per hour, TANF values are $0, values are static for Medicaid and child care, and SNAP values are monthly transitional values. Child Care values assume no parent share of cost based on 12-month eligibility for Choices Child Care. Housing and transportation costs are not included. Date Source: Single Parent Family Income and Assistance Model, Texas Workforce Investment Council. October 2022
2023 Hourly Wage and Benefit Scenarios for a Single Parent with Two Children (Calculated Assuming Full-time Employment of 40 Hours per Week and Four Months of Earned Income Disregard) $31.00 $29.66 $28.42* Child Care $28.00 $27.09 $6.77 Medicaid $25.29 $26.00 $6.77 $6.77 SNAP (FS) $6.77 $6.77 $21.00 TANF $5.97 $5.97 $5.97 EITC $5.97 $0.43 $5.97 $16.00 $0.98 $1.49 Gross Wages $1.15 $1.54 $2.12 $1.96 $0.29 $2.18 $11.00 $2.52 $0.38 Federal Poverty Threshold $11.07 $2.75 $15.00 $12.74 $6.00 $12.00 $10.00 $7.25 $1.00 $7.25/hour (Min.Wage) $10.00/hour $12.00/hour $12.74/hour* $15.00/hour -$4.00 * $12.74 per hour is the state average beginning wage (from September 1, 2021 to August 31, 2022) for Choices participants entering employment. Note: Starting at $12.00 per hour, TANF values are $0. Values are static for Medicaid and child care. Child Care values assume no parent share of cost based on 12-month eligibility for Choices Child Care. SNAP values are derived by using four months of Earned Income Disregard (EID) values plus eight months of Transitional values. Values assume full-time employment of 2,080 hours per year. Housing and transportation costs are not included. Date Source: Single Parent Family Income and Assistance Model, Texas Workforce Investment Council. October 2022
2023 Annual Wage and Benefit Scenarios for a TANF-Applicant Single Parent with Two Children (Calculated Assuming Full-time Employment of 40 Hours per Week) $60,000 Child Care $53,544 CHIP II $50,964* $50,100 $50,000 $47,832 $14,076 SNAP (FS) $43,920 $14,076 $14,076 $14,076 EITC $40,000 $4,296 $14,076 Gross Wages $4,296 $900 $4,296 $3,096 $4,296 $2,028 $30,000 $2,388 $4,080 $4,296 $3,396 $4,404 $4,764 $5,280 Federal Poverty Threshold $23,030 $20,000 $5,712 $31,176 $24,936 $26,484 $20,784 $10,000 $15,072 $0 $7.25/hour (Min.Wage) $10.00/hour $12.00/hour $12.74/hour* $15.00/hour * $12.74 per hour is the state average beginning wage (from September 1, 2021 to August 31, 2022) for Choices participants entering employment. Note: Values are static for CHIP II and child care. Child Care values assume no parent share of cost based on 12-month eligibility for TANF Applicant Child Care. SNAP annual values are derived by using twelve months of transitional values. Housing and transportation costs are not included. Date Source: Single Parent Family Income and Assistance Model, Texas Workforce Investment Council. October 2022
2023 Monthly Wage and Benefit Scenarios for a TANF-Applicant Single Parent with Two Children (Calculated Assuming Full-time Employment of 40 Hours per Week with Transitional Benefits) $5,000 Child Care $4,462 $4,500 $4,247* CHIP II $ 4,175 $3,986 $4,000 SNAP (FS) $1,173 $3,660 $1,173 $1,173 EITC $3,500 $1,173 $358 Gross Wages $1,173 $3,000 $358 $75 $358 $258 $169 $358 $199 $2,500 $340 $283 $358 $367 $2,000 $440 $397 Federal Poverty Threshold $1,919 $1,500 $476 $2,598 $2,207 $2,078 $1,000 $1,732 $1,256 $500 $0 $7.25/hour (Min.Wage) $10.00/hour $12.00/hour $12.74/hour* $15.00/hour * $12.74 per hour is the state average beginning wage (from September 1, 2021 to August 31, 2022) Choices participants entering employment. Note: Values are static for CHIP II and child care. Child Care values assume no parent share of cost based on 12-month eligibility for TANF Applicant Child Care. SNAP values are monthly transitional values. Housing and transportation costs are not included. Date Source: Single Parent Family Income and Assistance Model, Texas Workforce Investment Council. October 2022
2023 Hourly Wage and Benefit Scenarios for a TANF-Applicant Single Parent with Two Children (Calculated Assuming Full-time Employment of 40 Hours per Week) $31.00 Child Care CHIP II $25.75 $26.00 $24.51* $24.10 SNAP (FS) $23.00 $21.12 $6.77 $6.77 $21.00 $6.77 EITC $6.77 $2.07 $6.77 Gross Wages $2.07 $2.07 $0.43 $16.00 $1.49 $0.98 $2.07 $1.15 $2.07 $1.96 $1.63 $2.12 $2.54 $2.29 $11.00 $2.75 $15.00 Federal Poverty Threshold $11.07 $12.74 $12.00 $6.00 $10.00 $7.25 $1.00 $7.25/hour (Min.Wage) $10.00/hour $12.00/hour $12.74/hour* $15.00/hour -$4.00 * $12.74 per hour is the state average beginning wage (from September 1, 2021 to August 31, 2022) for Choices participants entering employment. Note: Values are static for CHIP II and child care. Child Care values assume no parent share of cost based on 12-month eligibility for TANF Applicant Child Care. SNAP values are derived by using twelve months of transitional values. Values assume full-time employment of 2,080 hours per year. Housing and transportation costs are not included. Date Source: Single Parent Family Income and Assistance Model, Texas Workforce Investment Council. October 2022
