Comparative Analysis of Injury Statistics Between Colorado and National Data
This study compares injury statistics between Colorado and national data, focusing on injury deaths, hospitalizations, and diagnosis codes. The purpose is to analyze NHDS and HCUPNet data for national estimates, highlighting differences in hospital discharges for various injury categories. The analysis includes percentages of hospital discharges for injury and poisoning, fractures, and complications of medical/surgical care. Additionally, the study examines hospital discharges for poisoning rates per 10,000 population by age group in Colorado.
Download Presentation

Please find below an Image/Link to download the presentation.
The content on the website is provided AS IS for your information and personal use only. It may not be sold, licensed, or shared on other websites without obtaining consent from the author.If you encounter any issues during the download, it is possible that the publisher has removed the file from their server.
You are allowed to download the files provided on this website for personal or commercial use, subject to the condition that they are used lawfully. All files are the property of their respective owners.
The content on the website is provided AS IS for your information and personal use only. It may not be sold, licensed, or shared on other websites without obtaining consent from the author.
E N D
Presentation Transcript
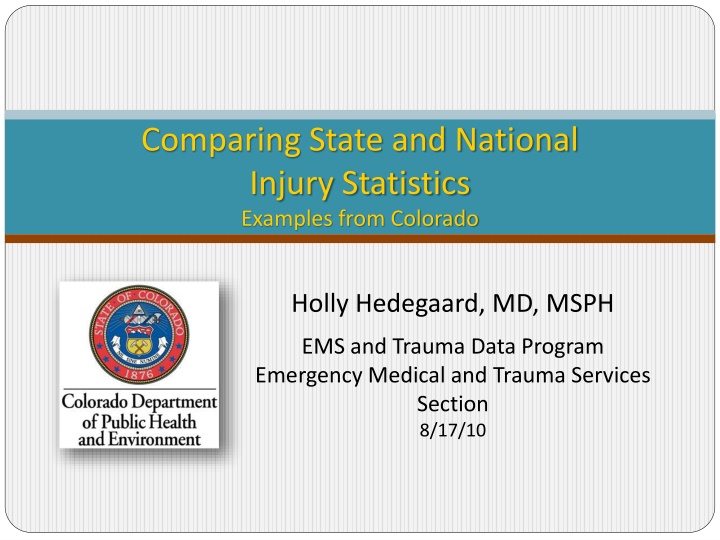
Comparing State and National Injury Statistics Examples from Colorado Holly Hedegaard, MD, MSPH EMS and Trauma Data Program Emergency Medical and Trauma Services Section 8/17/10
Injury Deaths and Hospitalizations Deaths National Vital Statistics System www.cdc.gov/nchs/nvss.htm WONDER, WISQARS Hospitalizations National Hospital Discharge Survey www.cdc.gov/nchs/nhds.htm AHRQ HCUPNet (Nationwide Inpatient Sample, NIS) hcupnet.ahrq.gov/
Purpose of the Study Compare NHDS and HCUPNet for national estimates of injury hospitalizations Compare Colorado to national estimates
ICD-9-CM Diagnosis Codes ICD-9-CM 800-999 All Injury and Poisoning Injury Poisoning Complications of med/surg care 800-959, 990-995 960-989 996-999 800-829 Fractures, all sites Fracture, neck of femur 820 First listed diagnosis only
Comparison of National Estimates Injury Discharges in 2006 NHDS (Number in Thousands) 2,968 HCUPNet* (Number in Thousands) 2,873 All Injury and Poisoning Injury Poisoning 1,785 271 1,632 270 Complications of med/surg care 912 970 Fractures, all sites 1,074 1,032 Fracture, neck of femur 330 304 First listed diagnosis only
Percent of All Hospital Discharges for Injury and Poisoning in 2006 60% 60% 57% 34% 31% 31% 9% 9% 9% Injury Poisoning Complication of med/surg care NHDS HCUPNet Colorado
Percent of All Hospital Discharges for Injury and Poisoning in 2006 39% 36% 36% 11% 11% 10% Fractures, all sites Fracture, Neck of Femur NHDS HCUPNet Colorado
Hospital Discharges for Poisoning Rate per 10,000 population by Age Group 12.5 9.8 9.3 9.1 8.7 8.5 7.4 6.9 2.6 1.4 All Ages 0-14 15-44 45-64 65+ NHDS Colorado
Hospital Discharges for Femoral Neck Fracture, Patients Age 65+ Rate per 10,000 population 78.7 76.7 71.5 NHDS HCUPNet Colorado
Average Hospital Length of Stay (days) for Femoral Neck Fracture, Patients Age 65+ 6.2 6.2 5.3 NHDS HCUPNet Colorado
These results suggest that Similar estimates for injury and poisoning hospital discharges can be obtained from NHDS and the HCUP National Inpatient Sample States can use these tools to compare their injury hospitalization rates with national estimates
Thank You! Holly Hedegaard, MD, MSPH EMS and Trauma Data Program Colorado Department of Public Health & Environment holly.hedegaard@state.co.us (303) 692-3005
