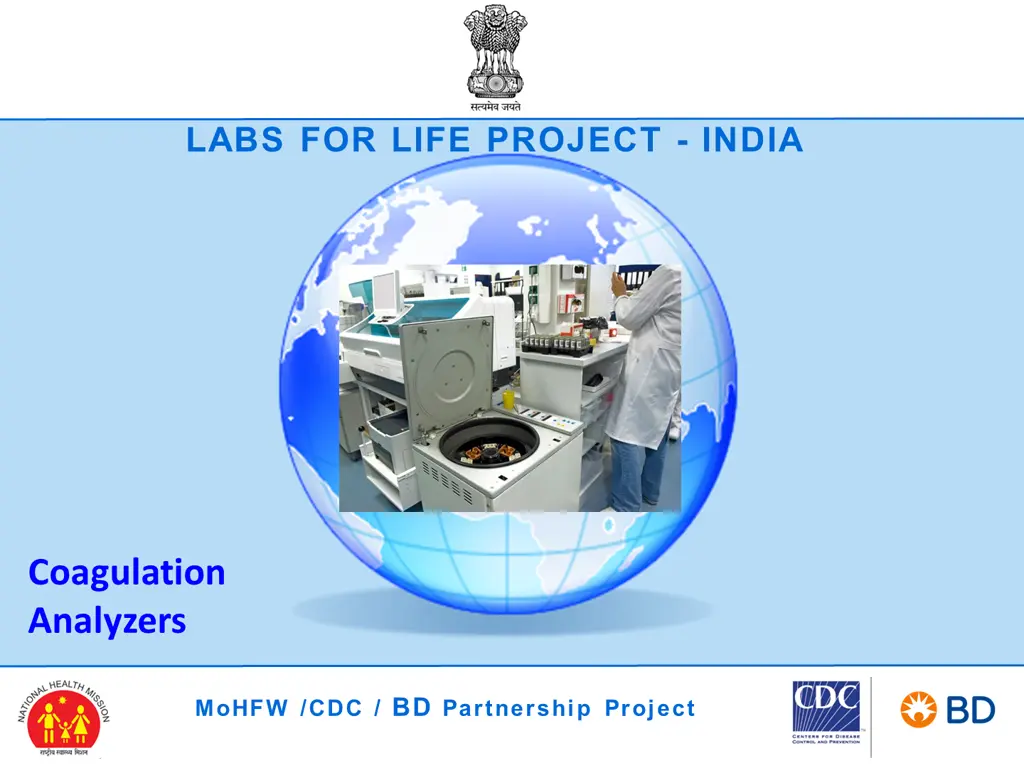
Coagulation Analyzers


M
o
H
F
W
/
C
D
C
/
B
D
P
a
r
t
n
e
r
s
h
i
p
P
r
o
j
e
c
t


L
A
B
S
F
O
R
L
I
F
E
P
R
O
J
E
C
T
-
I
N
D
I
A


Coagulation
Analyzers
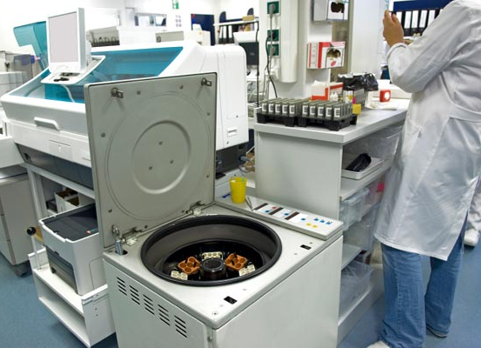


Current Instrumentation
Coagulation Analyzers
•
Coagulation analyzers perform in vitro
tests that are used to identify
hemostatic defects and monitor
anticoagulant therapy.
•
Fully automated coagulation analyzers:
–
Capable of automatic delivery of
reagents and plasma samples
–
Positive sample identification
–
Automatic dilution of samples
–
Sample, Calibration and QC data
management
•
Semi-automated analyzers:
–
Manual mixing of reagent and samples
–
Analyzer has capability to store
calibration curve and basic sample results
M
o
H
F
W
/
C
D
C
/
B
D
P
a
r
t
n
e
r
s
h
i
p
P
r
o
j
e
c
t
Basic Principle - To See or To Feel
Automation approaches to clot
detection:
–
SEE
•
Turbidometric
•
Nephelometric
–
FEEL
•
Mechanical/Viscosity based
Principle of coagulation testing
Various coagulation analyzers use different ways to detect clotting.
Electromechanical
•
Formation of fibrin strands around a steel ball in reaction
cuvette leads to change in the magnetic field, and the
coagulation time is recorded.
Photo-optical
•
The turbidity during the formation of a fibrin clot is measured as
an increase in scattered light intensity when exposed to light at a
wavelength.
Transmitted Light Detection for Chromogenic assay
•
Color production leads to a change in light absorbance, which is
detected as a change in transmitted light.
Transmitted Light Detection for Immunoassay
•
The change in light absorbance caused by the antigen antibody
reaction is detected as the change in transmitted light. Over
time, the change in absorbance per minute is calculated.
Nephelometry
•
Determination of the intensity of light scatter using a detector
placed at right angles
M
o
H
F
W
/
C
D
C
/
B
D
P
a
r
t
n
e
r
s
h
i
p
P
r
o
j
e
c
t
Photo-optic clot detection
Optical Clot Detection
(Turbidimetry)
•
Sample is added to a cuvette
•
A light source is directed through
the cuvette
•
Initial absorbance of transmitted
light is measured
•
Clot initiating reagents are added by
the automated instrumentation
•
The plasma becomes more opaque
when clotting is initiated,
decreasing the light transmitted
through the cuvette
•
The change in transmitted light is
used to calculate the result
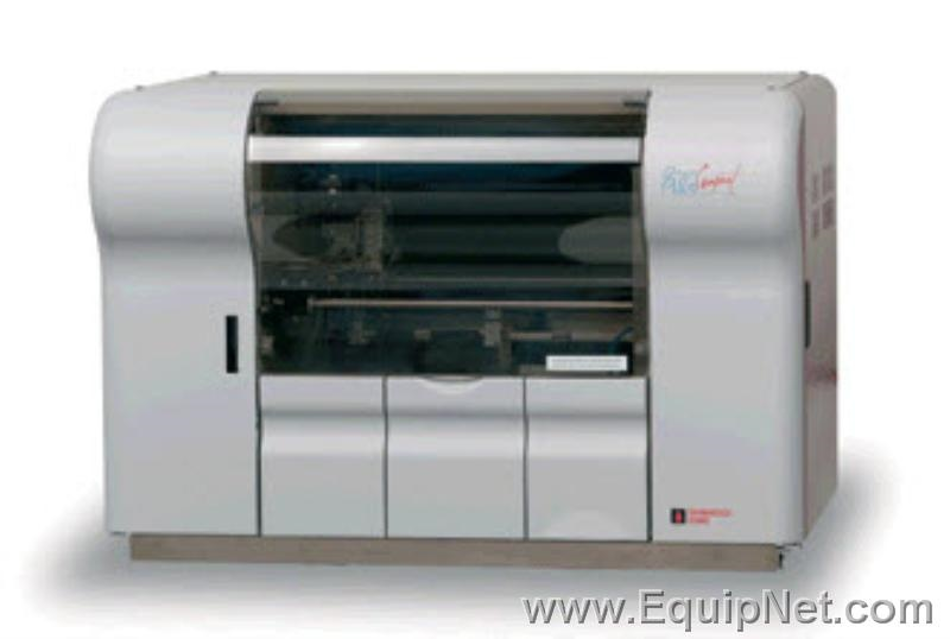
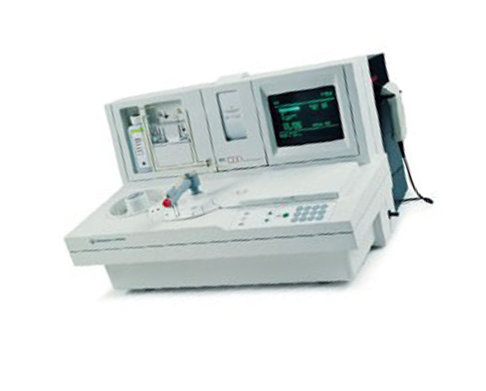
Cascade M-4
(Instruments at RRC)
•
Multiple (2 or 4) cuvettes can be
analyzed at one time
•
Semi-automated Optical Clot
Detection
–
The user delivers the sample and
reagents into the cuvette
–
The changes in optical density are
monitored
–
Clot times determined by
instrument
Nephelometric Clot Detection
•
Sample is added to a sample cuvette
•
The optically clear cuvette passes in
front of light source
•
The clot initiating reagents are added
•
Light is scattered as the fibrin strands
form
•
The light scatters at different angles
and is measured by detectors
•
A clot curve is generated by
consecutive readings until clot
completion.
Mechanical Clot Detection
•
The sample is introduced to a cuvette that has a
small steel ball inside
•
The cuvette continuously moves when testing
begins
•
The clot initiating reagents are added to the
sample
•
The fibrin strands begin to form and attach to
the moving ball
•
An electrical circuit is either opened or closed
when the ball moves away from the magnet
because of the fibrin strands
•
Clot time is recorded.
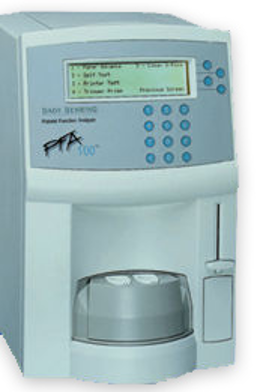
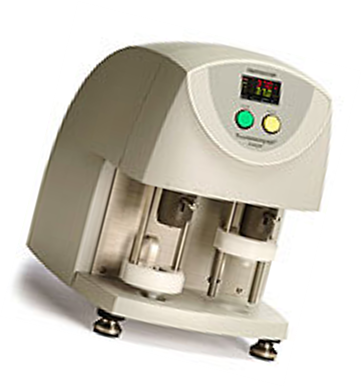
Mechanical Clot Detection
Semi-Automated Mechanical Clot
Detection
:
•
The Ball Method uses a steel ball at the
bottom of a cuvette that is held in place by
a magnetic source.
•
While the cuvette continuously rotates,
the technician adds the sample and
reagents, which starts the timer. T
•
When true clot formation has occurred,
the clot will incorporate the steel ball and
pull it away from the magnetic source,
stopping the timer.
Tests that use a Clot Detection Method
•
PT
•
APTT
•
TT
•
Fibrinogen
•
Mixing Studies
•
Specific Coagulation Factor Assays
–
FVIII
–
FIX
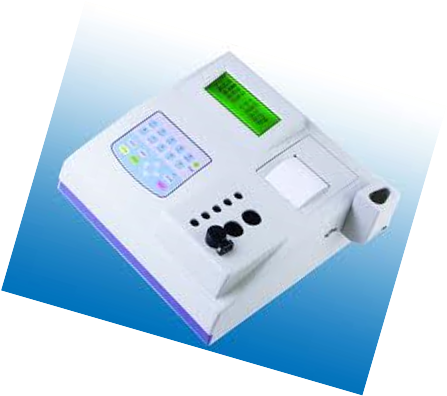
Key Components – Coagulation analyzer
CA-500
Maintenance of CA-500 (Example)
D
a
i
l
y
M
a
i
n
t
e
n
a
n
c
e
:
•
Clean sample probe
•
Discard Used Reaction Tubes
•
Dispose of Waste
•
Remove Dew from Reagent Rack
M
o
n
t
h
l
y
M
a
i
n
t
e
n
a
n
c
e
:
•
LED Lamp Calibration
Y
e
a
r
l
y
M
a
i
n
t
e
n
a
n
c
e
:
•
Replace rinse filter
A
s
N
e
e
d
e
d
M
a
i
n
t
e
n
a
n
c
e
:
•
Check Printer Paper Supply
•
Replace Fuse
•
Check and Drain Trap Chamber
•
Clean Instrument
Troubleshooting in CA-500 (Example)
•
Be familiar with the key
error messages and their
causes
•
Follow step-by-step
approach as discussed in
troubleshooting session
•
Advanced analyzers have
on-board self error
detection capabilities
The current instrumentation used for coagulation analysis in India through the MoHFW/CDC/BD partnership project. Understand the basic principles and various detection methods used in coagulation testing.

Download Presentation

Please find below an Image/Link to download the presentation.
The content on the website is provided AS IS for your information and personal use only. It may not be sold, licensed, or shared on other websites without obtaining consent from the author.If you encounter any issues during the download, it is possible that the publisher has removed the file from their server.
You are allowed to download the files provided on this website for personal or commercial use, subject to the condition that they are used lawfully. All files are the property of their respective owners.
The content on the website is provided AS IS for your information and personal use only. It may not be sold, licensed, or shared on other websites without obtaining consent from the author.
E N D
Presentation Transcript
LABS FOR LIFE PROJECT - INDIA Coagulation Analyzers MoHFW /CDC / BD Partnership Project
Coagulation Analyzers Coagulation analyzers perform in vitro tests that are used to identify hemostatic defects and monitor anticoagulant therapy. Fully automated coagulation analyzers: Capable of automatic delivery of reagents and plasma samples Positive sample identification Automatic dilution of samples Sample, Calibration and QC data management Semi-automated analyzers: Manual mixing of reagent and samples Analyzer has capability to store calibration curve and basic sample results MoHFW /CDC / BD Partnership Project
Basic Principle - To See or To Feel Automation approaches to clot detection: SEE Turbidometric Nephelometric FEEL Mechanical/Viscosity based
Principle of coagulation testing Various coagulation analyzers use different ways to detect clotting. Electromechanical Formation of fibrin strands around a steel ball in reaction cuvette leads to change in the magnetic field, and the coagulation time is recorded. Photo-optical The turbidity during the formation of a fibrin clot is measured as an increase in scattered light intensity when exposed to light at a wavelength. Transmitted Light Detection for Chromogenic assay Color production leads to a change in light absorbance, which is detected as a change in transmitted light. Transmitted Light Detection for Immunoassay The change in light absorbance caused by the antigen antibody reaction is detected as the change in transmitted light. Over time, the change in absorbance per minute is calculated. Nephelometry Determination of the intensity of light scatter using a detector placed at right angles Photo-optic clot detection MoHFW /CDC / BD Partnership Project
Optical Clot Detection (Turbidimetry) Sample is added to a cuvette A light source is directed through the cuvette Initial absorbance of transmitted light is measured Clot initiating reagents are added by the automated instrumentation The plasma becomes more opaque when clotting is initiated, decreasing the light transmitted through the cuvette The change in transmitted light is used to calculate the result
Cascade M-4 (Instruments at RRC) Multiple (2 or 4) cuvettes can be analyzed at one time Semi-automated Optical Clot Detection The user delivers the sample and reagents into the cuvette The changes in optical density are monitored Clot times determined by instrument
Nephelometric Clot Detection Sample is added to a sample cuvette The optically clear cuvette passes in front of light source The clot initiating reagents are added Light is scattered as the fibrin strands form The light scatters at different angles and is measured by detectors A clot curve is generated by consecutive readings until clot completion.
Mechanical Clot Detection The sample is introduced to a cuvette that has a small steel ball inside The cuvette continuously moves when testing begins The clot initiating reagents are added to the sample The fibrin strands begin to form and attach to the moving ball An electrical circuit is either opened or closed when the ball moves away from the magnet because of the fibrin strands Clot time is recorded.
Mechanical Clot Detection Semi-Automated Mechanical Clot Detection: The Ball Method uses a steel ball at the bottom of a cuvette that is held in place by a magnetic source. While the cuvette continuously rotates, the technician adds the sample and reagents, which starts the timer. T When true clot formation has occurred, the clot will incorporate the steel ball and pull it away from the magnetic source, stopping the timer.
Tests that use a Clot Detection Method PT APTT TT Fibrinogen Mixing Studies Specific Coagulation Factor Assays FVIII FIX
Maintenance of CA-500 (Example) Daily Maintenance: Clean sample probe Discard Used Reaction Tubes Dispose of Waste Remove Dew from Reagent Rack Monthly Maintenance: LED Lamp Calibration Yearly Maintenance: Replace rinse filter As Needed Maintenance: Check Printer Paper Supply Replace Fuse Check and Drain Trap Chamber Clean Instrument
Troubleshooting in CA-500 (Example) Be familiar with the key error messages and their causes Follow step-by-step approach as discussed in troubleshooting session Advanced analyzers have on-board self error detection capabilities


")
")