Clustering Algorithms in Data Science

This content discusses clustering algorithms such as K-Means, K-Medoids, and Hierarchical Clustering. It explains the concepts, methods, and applications of partitioning and clustering objects in a dataset for data analysis. The text covers techniques like PAM (Partitioning Around Medoids) and AGNES (Agglomerative Nesting) in detail, providing insights into how these algorithms work to group similar data points together.

Download Presentation

Please find below an Image/Link to download the presentation.
The content on the website is provided AS IS for your information and personal use only. It may not be sold, licensed, or shared on other websites without obtaining consent from the author.If you encounter any issues during the download, it is possible that the publisher has removed the file from their server.
You are allowed to download the files provided on this website for personal or commercial use, subject to the condition that they are used lawfully. All files are the property of their respective owners.
The content on the website is provided AS IS for your information and personal use only. It may not be sold, licensed, or shared on other websites without obtaining consent from the author.
E N D
Presentation Transcript
Final Review Lei Chen
Clustering Algorithms K-Means
Partitioning Algorithms: Basic Concept Partitioning method: Partitioning a database D of n objects into a set of k clusters, such that the sum of squared distances is minimized (where ciis the centroid or medoid of cluster Ci) = = 2 k i ( ( , )) E d p c 1 p C i i Given k, find a partition of k clusters that optimizes the chosen partitioning criterion Global optimal: exhaustively enumerate all partitions Heuristic methods: k-means and k-medoids algorithms k-means (MacQueen 67, Lloyd 57/ 82): Each cluster is represented by the center of the cluster k-medoids or PAM (Partition around medoids) (Kaufman & Rousseeuw 87): Each cluster is represented by one of the objects in the cluster 3
Clustering Algorithms K-Means K-Medoids
PAM (Partitioning Around Medoids) (1987) PAM (Kaufman and Rousseeuw, 1987), built in Splus Use real object to represent the cluster Select k representative objects arbitrarily For each pair of non-selected object h and selected object i, calculate the total swapping cost TCih For each pair of i and h, If TCih< 0, i is replaced by h Then assign each non-selected object to the most similar representative object repeat steps 2-3 until there is no change 5
Clustering Algorithms K-Means K-Medoids Hierarchical Clustering
Hierarchical Clustering Use distance matrix as clustering criteria. This method does not require the number of clusters k as an input, but needs a termination condition Step 1 Step 2 Step 3 Step 4 Step 0 agglomerative (AGNES) a a b b a b c d e c c d e d d e e divisive (DIANA) Step 3 Step 2 Step 1 Step 0 Step 4 7
AGNES (Agglomerative Nesting) Introduced in Kaufmann and Rousseeuw (1990) Implemented in statistical packages, e.g., Splus Use the single-link method and the dissimilarity matrix Merge nodes that have the least dissimilarity Go on in a non-descending fashion Eventually all nodes belong to the same cluster 10 10 10 9 9 9 8 8 8 7 7 7 6 6 6 5 5 5 4 4 4 3 3 3 2 2 2 1 1 1 0 0 0 0 1 2 3 4 5 6 7 8 9 10 0 1 2 3 4 5 6 7 8 9 10 0 1 2 3 4 5 6 7 8 9 10 8
Distance between Clusters X X Single link: smallest distance between an element in one cluster and an element in the other, i.e., dist(Ki, Kj) = min(tip, tjq) Complete link: largest distance between an element in one cluster and an element in the other, i.e., dist(Ki, Kj) = max(tip, tjq) Average: avg distance between an element in one cluster and an element in the other, i.e., dist(Ki, Kj) = avg(tip, tjq) Centroid: distance between the centroids of two clusters, i.e., dist(Ki, Kj) = dist(Ci, Cj) Medoid: distance between the medoids of two clusters, i.e., dist(Ki, Kj) = dist(Mi, Mj) Medoid: a chosen, centrally located object in the cluster 9
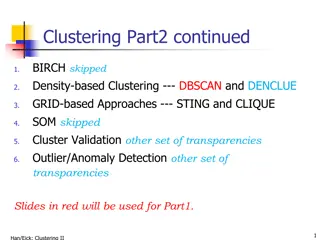
Clustering Algorithms K-Means K-Medoids Hierarchical Clustering Density-based Clustering
Density-Based Clustering: Basic Concepts Two parameters: Eps: Maximum radius of the neighbourhood MinPts: Minimum number of points in an Eps- neighbourhood of that point NEps(q): {p belongs to D | dist(p,q) Eps} Directly density-reachable: A point p is directly density- reachable from a point q w.r.t. Eps, MinPts if p belongs to NEps(q) core point condition: p MinPts = 5 Eps = 1 cm |NEps(q)| MinPts q 11
Density-Reachable and Density-Connected Density-reachable: A point p is density-reachable from a point q w.r.t. Eps, MinPts if there is a chain of points p1, , pn, p1= q, pn= p such that pi+1is directly density- reachable from pi Density-connected p p1 q A point p is density-connected to a point q w.r.t. Eps, MinPts if there is a point o such that both, p and q are density-reachable from o w.r.t. Eps and MinPts p q o 12
DBSCAN: Density-Based Spatial Clustering of Applications with Noise Relies on a density-based notion of cluster: A cluster is defined as a maximal set of density-connected points Discovers clusters of arbitrary shape in spatial databases with noise Outlier Border Eps = 1cm MinPts = 5 Core A point is a core point if it has more than a specified number of points (MinPts) within Eps These are points that are at the interior of a cluster A border point has fewer than MinPts within Eps, but is in the neighborhood of a core point 13
DBSCAN: The Algorithm Arbitrary select a point p Retrieve all points density-reachable from p w.r.t. Eps and MinPts If p is a core point, a cluster is formed If p is a border point, no points are density-reachable from p and DBSCAN visits the next point of the database Continue the process until all of the points have been processed 14
Clustering Algorithms K-Means K-Medoids Hierarchical Clustering Density-based Clustering Fuzzy set-based Clustering Measuring Clustering Quality
Fuzzy (Soft) Clustering Example: Let cluster features be C1: digital camera and lens C2: computer Fuzzy clustering k fuzzy clusters C1, ,Ck,represented as a partition matrix M = [wij] P1: for each object oiand cluster Cj, 0 wij 1 (fuzzy set) P2: for each object oi, , equal participation in the clustering P3: for each cluster Cj, ensures there is no empty cluster Let c1, , ckas the center of the k clusters For an object oi, sum of the squared error (SSE), p is a parameter: For a cluster Ci, SSE: Measure how well a clustering fits the data: 16
The EM (Expectation Maximization) Algorithm The k-means algorithm has two steps at each iteration: Expectation Step (E-step): Given the current cluster centers, each object is assigned to the cluster whose center is closest to the object: An object is expected to belong to the closest cluster Maximization Step (M-step): Given the cluster assignment, for each cluster, the algorithm adjusts the center so that the sum of distance from the objects assigned to this cluster and the new center is minimized The (EM) algorithm: A framework to approach maximum likelihood or maximum a posteriori estimates of parameters in statistical models. E-step assigns objects to clusters according to the current fuzzy clustering or parameters of probabilistic clusters M-step finds the new clustering or parameters that maximize the sum of squared error (SSE) or the expected likelihood 17
Fuzzy Clustering Using the EM Algorithm Initially, let c1= a and c2= b 1stE-step: assign o to c1,w. wt = 1stM-step: recalculate the centroids according to the partition matrix, minimizing the sum of squared error (SSE) Iteratively calculate this until the cluster centers converge or the change is small enough
Clustering Algorithms K-Means K-Medoids Hierarchical Clustering Density-based Clustering Fuzzy set-based Clustering Probabilistic Model-Based Clustering Measuring Clustering Quality
Model-Based Clustering A set C of k probabilistic clusters C1, ,Ckwith probability density functions f1, , fk, respectively, and their probabilities 1, , k. Probability of an object o generated by cluster Cjis Probability of o generated by the set of cluster C is Since objects are assumed to be generated independently, for a data set D = {o1, , on}, we have, Task: Find a set C of k probabilistic clusters s.t. P(D|C) is maximized However, maximizing P(D|C) is often intractable since the probability density function of a cluster can take an arbitrarily complicated form To make it computationally feasible (as a compromise), assume the probability density functions being some parameterized distributions 20
Univariate Gaussian Mixture Model O = {o1, , on} (n observed objects), = { 1, , k} (parameters of the k distributions), and Pj(oi| j) is the probability that oiis generated from the j-th distribution using parameter j, we have Univariate Gaussian mixture model Assume the probability density function of each cluster follows a 1- d Gaussian distribution. Suppose that there are k clusters. The probability density function of each cluster are centered at j with standard deviation j, j, = ( j, j), we have 21
Computing Mixture Models with EM Given n objects O = {o1, , on}, we want to mine a set of parameters = { 1, , k} s.t.,P(O| ) is maximized, where j= ( j, j) are the mean and standard deviation of the j-th univariate Gaussian distribution We initially assign random values to parameters j, then iteratively conduct the E- and M- steps until converge or sufficiently small change At the E-step, for each object oi, calculate the probability that oibelongs to each distribution, At the M-step, adjust the parameters j= ( j, j) so that the expected likelihood P(O| ) is maximized 22
Frequent Item Sets Brute-Force Solution
Frequent Itemset Generation Brute-force approach: Each itemset in the lattice is a candidate frequent itemset Count the support of each candidate by scanning the database Transactions List of Candidates TID Items 1 2 3 4 5 Bread, Milk Bread, Diaper, Beer, Eggs Milk, Diaper, Beer, Coke Bread, Milk, Diaper, Beer Bread, Milk, Diaper, Coke w M N Match each transaction against every candidate Complexity ~ O(NMw) => Expensive since M = 2d!!!
Frequent Itemset Generation Strategies Reduce the number of candidates (M) Complete search: M=2d Use pruning techniques to reduce M Reduce the number of transactions (N) Reduce size of N as the size of itemset increases Used by DHP and vertical-based mining algorithms Reduce the number of comparisons (NM) Use efficient data structures to store the candidates or transactions No need to match every candidate against every transaction
Frequent Item Sets Brute-Force Solution Apriori Property and Algorithm
Reducing Number of Candidates Apriori principle: If an itemset is frequent, then all of its subsets must also be frequent Apriori principle holds due to the following property of the support measure: ( : , X Y X ) ( ) ( ) Y s X s Y Support of an itemset never exceeds the support of its subsets This is known as the anti-monotone property of support
Apriori Algorithm Method: Let k=1 Generate frequent itemsets of length 1 Repeat until no new frequent itemsets are identified Generate length (k+1) candidate itemsets from length k frequent itemsets Prune candidate itemsets containing subsets of length k that are infrequent Count the support of each candidate by scanning the DB Eliminate candidates that are infrequent, leaving only those that are frequent
Frequent Item Sets Brute-Force Solution Apriori Property and Algorithm Hashing Tree
Reducing Number of Comparisons Candidate counting: Scan the database of transactions to determine the support of each candidate itemset To reduce the number of comparisons, store the candidates in a hash structure Instead of matching each transaction against every candidate, match it against candidates contained in the hashed buckets Transactions Hash Structure TID Items 1 2 3 4 5 Bread, Milk Bread, Diaper, Beer, Eggs Milk, Diaper, Beer, Coke Bread, Milk, Diaper, Beer Bread, Milk, Diaper, Coke k N Buckets
Generate Hash Tree Suppose you have 15 candidate itemsets of length 3: {1 4 5}, {1 2 4}, {4 5 7}, {1 2 5}, {4 5 8}, {1 5 9}, {1 3 6}, {2 3 4}, {5 6 7}, {3 4 5}, {3 5 6}, {3 5 7}, {6 8 9}, {3 6 7}, {3 6 8} You need: Hash function Max leaf size: max number of itemsets stored in a leaf node (if number of candidate itemsets exceeds max leaf size, split the node) Hash function 2 3 4 5 6 7 3,6,9 1,4,7 3 6 7 3 6 8 1 4 5 3 5 6 3 5 7 6 8 9 3 4 5 2,5,8 1 3 6 1 2 4 4 5 7 1 2 5 4 5 8 1 5 9
Maximal Frequent Itemset An itemset is maximal frequent if none of its immediate supersets is frequent null Maximal Itemsets A B C D E AB AC AD AE BC BD BE CD CE DE ABC ABD ABE ACD ACE ADE BCD BCE BDE CDE ABCD ABCE ABDE ACDE BCDE Infrequent Itemsets Border ABCD E
Closed Itemset An itemset is closed if none of its immediate supersets has the same support as the itemset Itemset {A} {B} {C} {D} {A,B} {A,C} {A,D} {B,C} {B,D} {C,D} Support 4 5 3 4 4 2 3 3 4 3 TID 1 2 3 4 5 Items {A,B} {B,C,D} {A,B,C,D} {A,B,D} {A,B,C,D} Itemset {A,B,C} {A,B,D} {A,C,D} {B,C,D} {A,B,C,D} Support 2 3 2 3 2
Frequent Item Sets Brute-Force Solution Apriori Property and Algorithm Hashing Tree FP-tree
FP-tree Scan the database once to store all essential information in a data structure called FP-tree (Frequent Pattern Tree) The FP-tree is concise and is used in directly generating large itemsets 35
FP-tree Step 1: Deduce the ordered frequent items. For items with the same frequency, the order is given by the alphabetical order. Step 2: Construct the FP-tree from the above data Step 3: From the FP-tree above, construct the FP- conditional tree for each item (or itemset). Step 4: Determine the frequent patterns. 36
Frequent Item Sets Brute-Force Solution Apriori Property and Algorithm Hashing Tree FP-tree Continuous and Categorical Attributes
Frequent Item Sets Brute-Force Solution Apriori Property and Algorithm Hashing Tree FP-tree Continuous and Categorical Attributes Sequence Pattern Mining
Sequential Pattern Mining: Definition Given: a database of sequences a user-specified minimum support threshold, minsup Task: Find all subsequences with support minsup
Sequential Pattern Mining: Example Object A A A B B C C C D D D E E Timestamp 1 2 3 1 2 1 2 3 1 2 3 1 2 Events 1,2,4 2,3 5 1,2 2,3,4 1, 2 2,3,4 2,4,5 2 3, 4 4, 5 1, 3 2, 4, 5 Minsup = 50% Examples of Frequent Subsequences: < {1,2} > < {2,3} > < {2,4}> < {3} {5}> < {1} {2} > < {2} {2} > < {1} {2,3} > < {2} {2,3} > < {1,2} {2,3} > s=60% s=60% s=80% s=80% s=80% s=60% s=60% s=60% s=60%
Generalized Sequential Pattern (GSP) Step 1: Make the first pass over the sequence database D to yield all the 1-element frequent sequences Step 2: Repeat until no new frequent sequences are found Candidate Generation: Merge pairs of frequent subsequences found in the (k-1)th pass to generate candidate sequences that contain k items Candidate Pruning: Prune candidate k-sequences that contain infrequent (k-1)-subsequences Support Counting: Make a new pass over the sequence database D to find the support for these candidate sequences Candidate Elimination: Eliminate candidate k-sequences whose actual support is less than minsup
Candidate Generation Base case (k=2): Merging two frequent 1-sequences <{i1}> and <{i2}> will produce two candidate 2-sequences: <{i1} {i2}> and <{i1 i2}> General case (k>2): A frequent (k-1)-sequence w1is merged with another frequent (k-1)-sequence w2to produce a candidate k-sequence if the subsequence obtained by removing the first event in w1is the same as the subsequence obtained by removing the last event in w2 The resulting candidate after merging is given by the sequence w1extended with the last event of w2. If the last two events in w2belong to the same element, then the last event in w2becomes part of the last element in w1 Otherwise, the last event in w2becomes a separate element appended to the end of w1
Candidate Generation Examples Merging the sequences w1=<{1} {2 3} {4}> and w2=<{2 3} {4 5}> will produce the candidate sequence < {1} {2 3} {4 5}> because the last two events in w2 (4 and 5) belong to the same element Merging the sequences w1=<{1} {2 3} {4}> and w2=<{2 3} {4} {5}> will produce the candidate sequence < {1} {2 3} {4} {5}> because the last two events in w2 (4 and 5) do not belong to the same element We do not have to merge the sequences w1=<{1} {2 6} {4}> and w2=<{1} {2} {4 5}> to produce the candidate < {1} {2 6} {4 5}> because if the latter is a viable candidate, then it can be obtained by merging w1with < {1} {2 6} {5}>
GSP Example Frequent 3-sequences Candidate Generation < {1} {2} {3} > < {1} {2 5} > < {1} {5} {3} > < {2} {3} {4} > < {2 5} {3} > < {3} {4} {5} > < {5} {3 4} > Candidate Pruning < {1} {2} {3} {4} > < {1} {2 5} {3} > < {1} {5} {3 4} > < {2} {3} {4} {5} > < {2 5} {3 4} > < {1} {2 5} {3} >
Frequent Item Sets Brute-Force Solution Apriori Property and Algorithm Hashing Tree FP-tree Continuous and Categorical Attributes Sequence Pattern Mining Time Constraint-based Sequence Pattern Mining
Mining Sequential Patterns with Timing Constraints Approach 1: Mine sequential patterns without timing constraints Postprocess the discovered patterns Approach 2: Modify GSP to directly prune candidates that violate timing constraints Question: Does Apriori principle still hold?
Contiguous Subsequences s is a contiguous subsequence of w = <e1>< e2> < ek> if any of the following conditions hold: 1. s is obtained from w by deleting an item from either e1or ek 2. s is obtained from w by deleting an item from any element eithat contains more than 2 items 3. s is a contiguous subsequence of s and s is a contiguous subsequence of w (recursive definition) Examples: s = < {1} {2} > is a contiguous subsequence of < {1} {2 3}>, < {1 2} {2} {3}>, and < {3 4} {1 2} {2 3} {4} > is not a contiguous subsequence of < {1} {3} {2}> and < {2} {1} {3} {2}>


 (1987)")


")


 Clustering")
 Algorithm")


")


")