Climate-FVS Model for Forest Stand Dynamics
Explore the Climate-FVS model, a tool using the Forest Vegetation Simulator to project stand dynamics in the face of changing climates. Learn about the model's architecture, operation, variants, and its integration with climate models. Discover the process flow from stand initialization to projecting future forest conditions. Additionally, delve into general circulation models used in climate analysis to understand the broader context of climate modeling.
Download Presentation

Please find below an Image/Link to download the presentation.
The content on the website is provided AS IS for your information and personal use only. It may not be sold, licensed, or shared on other websites without obtaining consent from the author.If you encounter any issues during the download, it is possible that the publisher has removed the file from their server.
You are allowed to download the files provided on this website for personal or commercial use, subject to the condition that they are used lawfully. All files are the property of their respective owners.
The content on the website is provided AS IS for your information and personal use only. It may not be sold, licensed, or shared on other websites without obtaining consent from the author.
E N D
Presentation Transcript
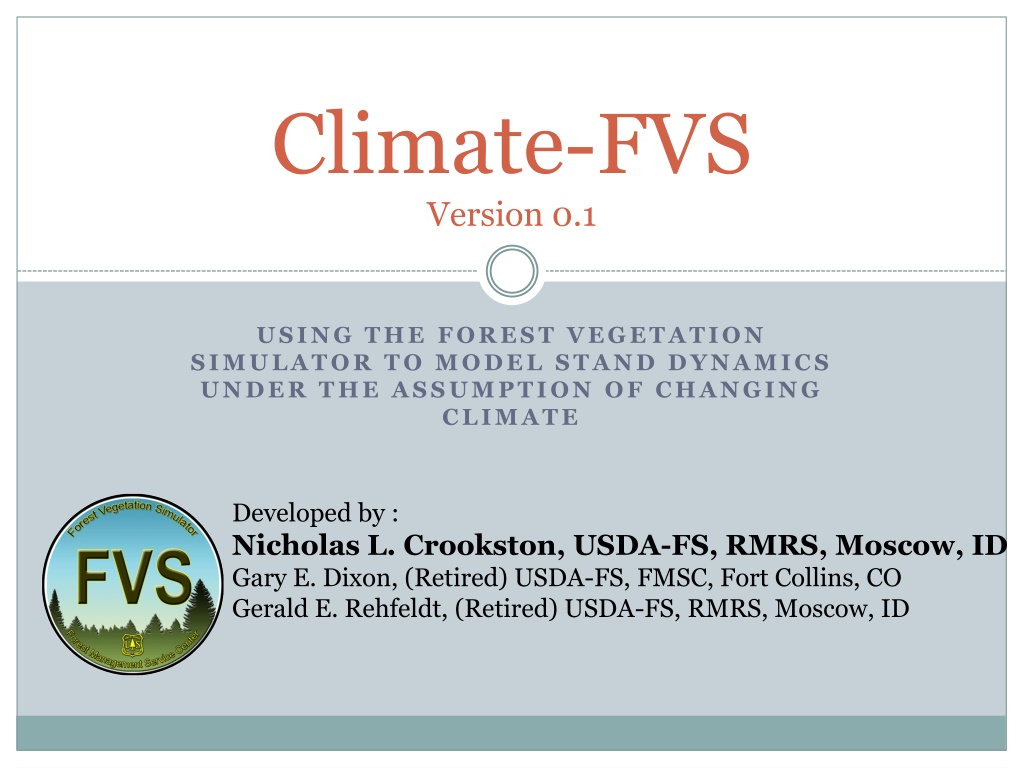
Climate-FVS Version 0.1 USING THE FOREST VEGETATION SIMULATOR TO MODEL STAND DYNAMICS UNDER THE ASSUMPTION OF CHANGING CLIMATE Developed by : Nicholas L. Crookston, USDA-FS, RMRS, Moscow, ID Gary E. Dixon, (Retired) USDA-FS, FMSC, Fort Collins, CO Gerald E. Rehfeldt, (Retired) USDA-FS, RMRS, Moscow, ID
Presentation Road Map Background on Base FVS Background on Climate Models Climate-FVS Architecture Climate-FVS How to
Description of FVS FVS is a distance-independent, individual-tree forest growth model widely used in the United States to support forest management decision-making Individual stands are the basic projection unit and projections are dependent on interactions among trees within stands, as well as site and stand conditions. FVS allows users to compare management scenarios, to meet landowner objectives. Extensions to FVS model the impact of disturbance- causing agents (fire, insects, and disease)
Variants of FVS The component models differ depending on the geographic region represented by regionally specific model variants Coefficients are estimated using available data from the variant s geographic region Each variant is a self- contained program executable written in FORTRAN (FORmula TRANslation) Under development
FVS Basic Operation FVS needs a keyword file to run Keywords are mnemonic words with associated data that provide information to FVS Keywords are used to enter stand and tree information describe management treatments control the printing of output adjust model estimates
Processing Sequence Initialize Stand Simulation Prior to Projection Individual Tree Growth (DBH & HT) Insect and Pathogen Adjustments Performs Cutting Activities Mortality Fire and Fuels Adjustments Growth Cycle Report Projected Conditions 3 2 1 Crown Change Regeneration End Stand Simulation
General Circulation Models Canadian Center of Climate Modeling and Analysis CGCM3-A2 CGCM3-B1 CGCM3-A1B Met Office Hadley Centre UK (HADMC3) HADMC3-A2 HADMC3-B2 Geophysical Fluid Dynamics Laboratory -Princeton University, NOAA Research (GFDLCM21) GFDLCM21-A2 GFDLCM21-B1
Example of Viability Scores Viability Scores* Location on Gifford Pinchot NF CODES: PSME TSHE PIPO 1990 0.973 0.96 0.376 2030 0.96 0.656 0.29 2060 0.857 0.236 0.546 2090 0.877 0.131 0.596 * Lat: 46.67, Long: 121.54, Elev: 2583, based on Hadley A2 Scenario
Douglas-fir climate profile -125 -120 -115 -110 -105 Douglas-fir climate profile location change (current to 2060) 45 45 40 40 new recede 35 35 stays -120 -115 -110 -105
Climate-FVS: Architecture Base FVS assumes site is constant over time, this assumption is not tenable under changing climate. The current structure of FVS to apply management has not changed Climate-FVS does NOT contain a climate model, it uses species viability scores. The species viability scores are for 75 western U.S. species predicted from seven future climate scenarios (presently based on Rehfeldt et al, but user could use any source of scores) Viability scores are used to compute mortality rates and modify FVS-predicted growth rates.
Changes to the model under Climate-FVS Carrying capacity may change Additional species specific mortality Species Establishment changes Growth is impacted by genetics by site quality changes
Site Carrying Capacity Changes maximum density as a function of climate. Presently FVS uses Maximum SDI or BA as a measure of carrying capacity and uses it to compute density related mortality. These maximum densities are typically species based and the maximum for the stand varies based on the basal area-weighted average maximum Climate-FVS computes a proportional change in carry capacity, where the viability scores are used instead of basal area-weighted to compute maximum density.
Additional Species Specific Mortality Additional species specific mortality is applied to all species with a viability score below 0.50. As the viability score decreases, the mortality rate increases. The mortality rate is proportional to the viability score.
Species Establishment Climate-FVS will establish 500 seedling/acre when stand density falls below a stocking threshold The four most viable species will be regenerated The number of trees of each species will be apportioned based on the relative viability scores The consequence is that more trees of the most viable species will be regenerated If no species are viable, none are regenerated.
Growth Site quality If the stand site quality changes due to climatic change, growth will be affected. The Annual Dryness Index (ADI) is used as an indicator of site quality change. As ADI increases or decreases compared to contemporary, it proportionally affects Site Quality. Tree genetics Trees growing on sites they are adapted for grow faster than those growing on site they are maladapted for. Transfer distances, seed zones
Growth modified based on Seed Transfer Distance MAT at seed source: -2 C MAT at seed source: 2 C MAT at seed source: 4 C MAT at seed source: 8 C 250 200 150 3-yrHt (cm) 100 50 0 -15 -10 -5 0 5 10 15 -50 Mean temp. of the coldest month transfer distance ( C) moved to colder climates moved to warmer climates Leites , L. (preliminary work, Univ. of Idaho)
How To Run Climate-FVS Obtain climate executable from FMSC Additional input file needed that contains viability scores One additional keyword is mandatory (CLIMDATA), that specifies the location of the viability scores files, and specifies the GCM scenario to be used. Four other option keywords can me used to change the assumptions on climate change impacts on growth, mortality, and regeneration.
Example of additional input file needed Filename: FVSClimAttrs.csv A source of the climate and species viability data file is at this web address: http://forest.moscowfsl.wsu.edu/climate/customData/fvs_ data.php.
Four Optional Keywords AutoEstb: Signal that Climate-FVS automatic establishment logic is turned on and that the base FVS automatic establishment features are turned off. GrowMult :Specify a species-specific adjustment of the growth-rate multiplier computed by Climate- FVS. MortMult :Specify a species-specific mortality multiplier. MxDenMlt: Specify an adjustment of the maximum density multiplier computed by Climate-FVS.
Climate-FVS Reports Main Output File Options Selected by input lists viability scores by species Climate Reports none yet developed see effects in standard output reports
Compare Scenarios BASE GCM Scenario Species Composition by Basal Area 2006 HADMC3_B2 Species Composition by Basal Area 2096 Live DF Live RC Live WH 1% 1% Live DF Live RC Live WH Live GF Live WP 0%0% 0% 1% 98% 99% HADMC3_A2 Species Composition by Basal Area 2096 Species Composition by Basal Area 2096 Live DF Live RC Live WH 0%1% Live DF Live GF Live WP 0% 0% 100% 99%
Climate-FVS Questions? Nicholas L. Crookston USDA- Forest Service Rocky Mountain Research Station, Moscow, Idaho ncrookston@fs.fed.us Forest Management Service Center USDA- Forest Service Fort Collins, CO wo_ftcol_fvs@fs.fed.us
