Chorus II Portfolios Results & Market Review Index Returns
 undefined
Chorus II Portfolios Results
as at September 30, 2016


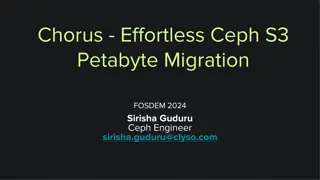
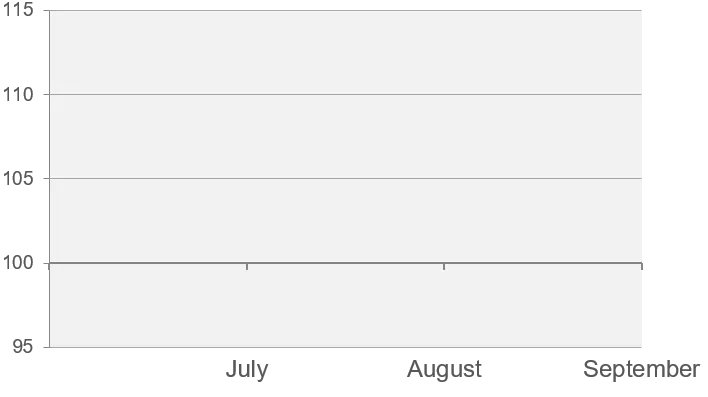
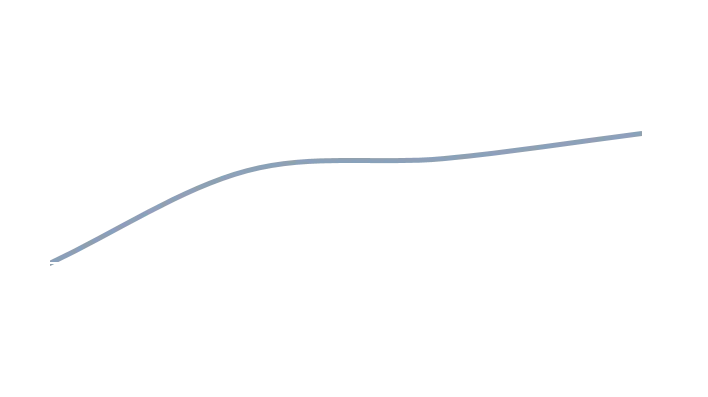
Market Review
Index Returns – 3rd Quarter 2016

Progression in the value of $100 (in Canadian Dollars)
Source : Morningstar Direct
1. Emerging Market Equities
2. International Equities
3. Canadian Equities
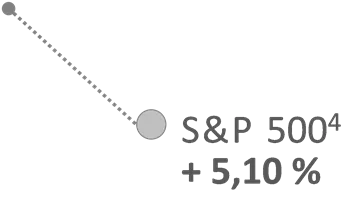
4. American Equities
5.
Canadian Bonds


FTSE TMX
5
Canada Univers
+ 1,19 %


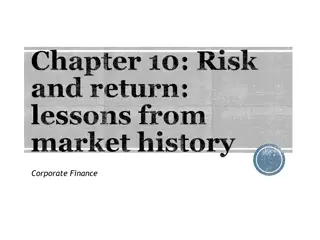
Chorus II Portfolio Performances
3rd Quarter 2016 Returns, in %
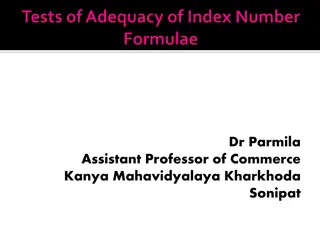
Performance Track Record
Chorus II Portfolios
TRUST CLASS*
(Returns as at September 30, 2016, in %)
N
/
A
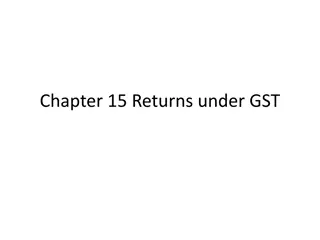
Performance Track Record
Chorus II Portfolios
CORPORATE CLASS*
(Returns as at September 30, 2016, in %)
N
/
A
The Desjardins Funds are not guaranteed, their value fluctuates frequently and their past performance is not indicative of their future returns.
The indicated rates of return are the historical annual compounded total returns as at September 30, 2016 including changes in securities
value and reinvestment of all distributions and do not take into account sales, redemption, distribution or optional charges or income taxes
payable by any security holder that would have reduced returns. Commissions, trailing commissions, management fees and expenses all may
be associated with mutual fund investments. Please read the prospectus before investing. The Desjardins Funds are offered by such registered
dealers as the Desjardins Financial Services Firm Inc., a mutual fund dealer belonging to the Desjardins Group that distributes the Funds in
caisses throughout Québec and Ontario, as well as through the Centre financier Desjardins.
This content details the performance of Chorus II portfolios, market review index returns, and performance track records as of September 30, 2016, including various investment categories. It also discusses the Desjardins Funds' nature, historical returns, and associated fees and taxes.

Download Presentation

Please find below an Image/Link to download the presentation.
The content on the website is provided AS IS for your information and personal use only. It may not be sold, licensed, or shared on other websites without obtaining consent from the author. Download presentation by click this link. If you encounter any issues during the download, it is possible that the publisher has removed the file from their server.
E N D
Presentation Transcript
Chorus II Portfolios Results as at September 30, 2016
Market Review Index Returns 3rd Quarter 2016 Progression in the value of $100 (in Canadian Dollars) 115 MSCI EM1 +10,33 % 110 MSCI EAFE2 +7,71 % 105 S&P/TSX3 +5,46 % S&P 5004 + 5,10 % FTSE TMX5 Canada Univers + 1,19 % 100 95 July August September Source : Morningstar Direct 1. Emerging Market Equities 2. International Equities 3. Canadian Equities 4. American Equities 5. Canadian Bonds
Chorus II Portfolio Performances 3rd Quarter 2016 Returns, in % 6.0 5.15 5.0 4.73 4.71 4.31 4.03 4.0 3.58 3.37 3.15 2.98 3.0 2.62 2.48 2.14 2.0 1.0 0.0 Conservative Balanced Income Balanced Growth Growth High Growth Maximum Growth Trust (A-Class Units) Corporate Class (Series A Shares)
Performance Track Record Chorus II Portfolios TRUST CLASS* (Returns as at September 30, 2016, in %) 1 year 3 years 5 years Since Inception 10.0 9.45 8.56 8.02 7.90 8.0 7.65 7.33 7.32 7.12 6.84 6.77 6.59 6.41 6.25 5.90 5.79 6.0 5.54 5.15 4.89 4.0 2.0 N/A 0.0 Conservative Balanced Income Balanced Growth Growth High Growth Maximum Growth * A-Class Units
Performance Track Record Chorus II Portfolios CORPORATE CLASS* (Returns as at September 30, 2016, in %) 1 year 3 years 5 years Since Inception 10.0 8.87 8.66 8.22 7.98 8.0 7.59 7.20 7.00 7.00 6.68 6.58 6.20 5.94 5.71 5.80 6.0 5.12 4.96 4.16 3.91 4.0 2.0 N/A 0.0 Conservative Balanced Income Balanced Growth Growth High Growth Maximum Growth * Series A Shares
The Desjardins Funds are not guaranteed, their value fluctuates frequently and their past performance is not indicative of their future returns. The indicated rates of return are the historical annual compounded total returns as at September 30, 2016 including changes in securities value and reinvestment of all distributions and do not take into account sales, redemption, distribution or optional charges or income taxes payable by any security holder that would have reduced returns. Commissions, trailing commissions, management fees and expenses all may be associated with mutual fund investments. Please read the prospectus before investing. The Desjardins Funds are offered by such registered dealers as the Desjardins Financial Services Firm Inc., a mutual fund dealer belonging to the Desjardins Group that distributes the Funds in caisses throughoutQu bec and Ontario, as well as throughthe Centre financier Desjardins.