Chapter 7 Review
Examples of confidence intervals in statistics, analyzing surveys on ethical beliefs, and interpreting results from crash test experiments. Understand how to construct confidence intervals and make inferences about population parameters based on sample data.
Download Presentation

Please find below an Image/Link to download the presentation.
The content on the website is provided AS IS for your information and personal use only. It may not be sold, licensed, or shared on other websites without obtaining consent from the author.If you encounter any issues during the download, it is possible that the publisher has removed the file from their server.
You are allowed to download the files provided on this website for personal or commercial use, subject to the condition that they are used lawfully. All files are the property of their respective owners.
The content on the website is provided AS IS for your information and personal use only. It may not be sold, licensed, or shared on other websites without obtaining consent from the author.
E N D
Presentation Transcript
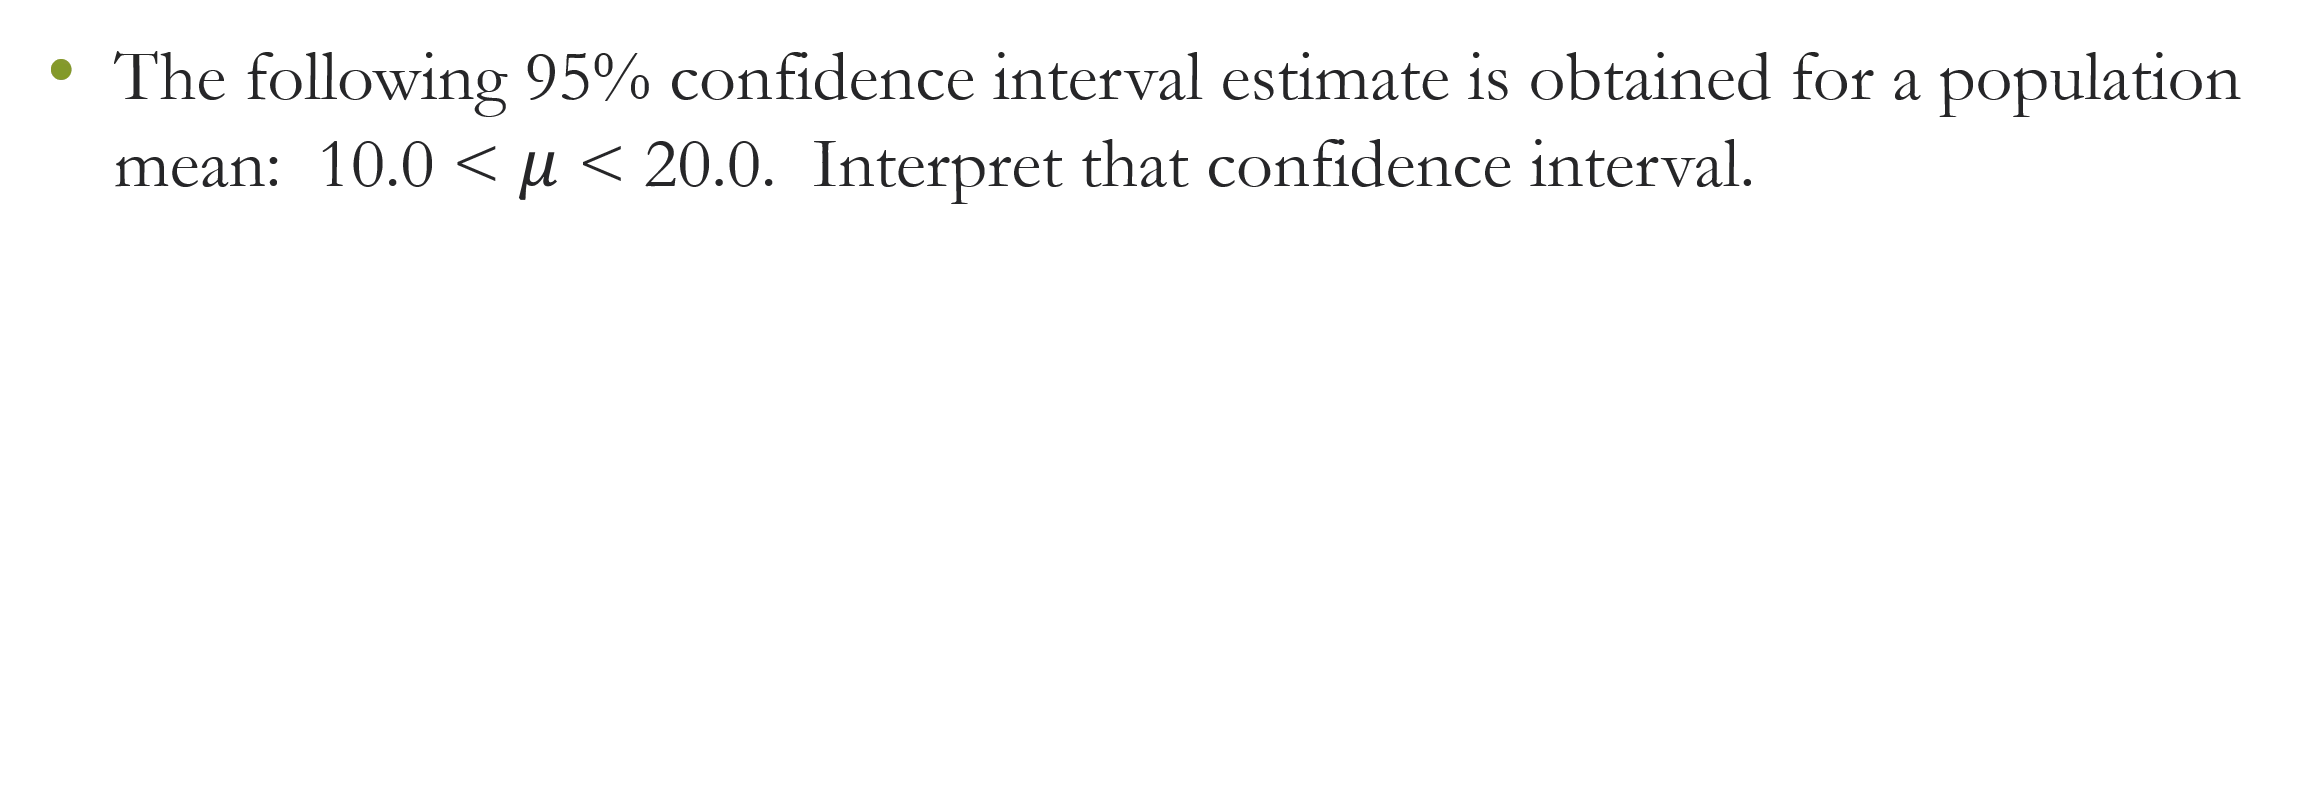
Confidence Intervals The following 95% confidence interval estimate is obtained for a population mean: 10.0 < ? < 20.0. Interpret that confidence interval.
Penny Weights In a Pew Research Center poll of 745 randomly selected adulats, 589 said that it is morally wrong to not report all income on tax returns. Construct a 95% confidence interval estimate of the percentage of all adults who have that belief, and then write a statement interpreting the confidence interval.
Crash Test Results A simple random sample of 37 weights of pennies made after 1983 has a mean of 2.4991 g and a standard deviation of 0.0165 g. Construct a 99% confidence interval estimate of the mean weight of all such pennies. Design specifications require a population mean of 2.5 g. What does the confidence interval suggest about the manufacturing process?
Confidence Intervals The National Transportation Safety Administration conducted crash test experiments of five subcompact cars. The head injury data (in hic) recorded from crash test dummies in the driver s seat are as follows: 681, 428, 917, 898, 420. Use these sample results to construct a 95% confidence interval for the mean of head injury measurements from all subcompact cars.
Confidence Intervals New car design specifications are being considered to control the variation of the head injury measurements. Use the same sample data from the previous slide to construct a 95% confidence interval for ?.
Cloning Survey A Gallup poll consisted of 1012 randomly selected adults who were asked whether cloning of humans should or should not be allowed. Results showed that 901 adults surveyed indicated that cloning should not be allowed. A. Find the best point estimate of the proportion of adults believing that cloning of humans should not be allowed.
Cloning Survey A Gallup poll consisted of 1012 randomly selected adults who were asked whether cloning of humans should or should not be allowed. Results showed that 901 adults surveyed indicated that cloning should not be allowed. B. Construct a 95% confidence interval estimate of the proportion of adults believing that cloning of humans should not be allowed.
Cloning Survey A Gallup poll consisted of 1012 randomly selected adults who were asked whether cloning of humans should or should not be allowed. Results showed that 901 adults surveyed indicated that cloning should not be allowed. C. A news reporter wants to determine whether these survey results constitute strong evidence that the majority (more than 50%) of people are opposed to such cloning. Base on the results, is there strong evidence supporting the claim that the majority is opposed to such cloning? Why or why not?
Discarded Glass Listed below are weights (in pounds) of glass discarded in one week by randomly selected households (based on data from the Garbage Project at the University of Arizona). 3.52 8.87 3.99 3.61 2.33 3.21 0.25 4.94 What is the best point estimate of the weight of glass discarded by all households in one week?
Discarded Glass Listed below are weights (in pounds) of glass discarded in one week by randomly selected households (based on data from the Garbage Project at the University of Arizona). 3.52 8.87 3.99 3.61 2.33 3.21 0.25 4.94 Construct a 95% confidence interval estimate of the mean weight of glass discarded by all households?
Discarded Glass Listed below are weights (in pounds) of glass discarded in one week by randomly selected households (based on data from the Garbage Project at the University of Arizona). 3.52 8.87 3.99 3.61 2.33 3.21 0.25 4.94 Construct a 95% confidence interval estimate of the mean weight of glass discarded by all households assuming that the population is normally distributed with a standard deviation known to be 3.108 lbs.

 undefined


