Challenges & Opportunities of Global WageIndicator Data
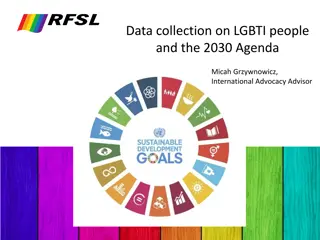
Using global WageIndicator data for scientific and policy research poses challenges and offers opportunities. Explore insights on data usage, biases in volunteer web surveys, and improving survey quality for evidence-based policies on inclusive growth.
Download Presentation

Please find below an Image/Link to download the presentation.
The content on the website is provided AS IS for your information and personal use only. It may not be sold, licensed, or shared on other websites without obtaining consent from the author.If you encounter any issues during the download, it is possible that the publisher has removed the file from their server.
You are allowed to download the files provided on this website for personal or commercial use, subject to the condition that they are used lawfully. All files are the property of their respective owners.
The content on the website is provided AS IS for your information and personal use only. It may not be sold, licensed, or shared on other websites without obtaining consent from the author.
E N D
Presentation Transcript
1. InGRID-2 Data Forum - WageIndicator 31.08.2017 This project has received funding from the European Union's Horizon 2020 Research and Innovation Programme under Grant Agreement no 730998
Objective Opportunities & challenges of using the global WageIndicator data for scientific and policy driven research First session: Introduction to the WageIndicator data and how users deal with the challenges Second session: Two perspectives on the use of non-probability samples + roundtable discussion Aim: new ideas of how to deal with the challenges of the WageIndicator data www.inclusivegrowth.eu www.inclusivegrowth.be Title/date 2
Some words about InGRID2 www.inclusivegrowth.eu Title/date 3
InGRID2 - Objectives Integrate and innovate existing European social sciences research infrastructures on Poverty and living conditions Working conditions and vulnerability by improving: Transnational data access Mutual knowledge exchange through activities Methods and tools for comparative research to create new & better opportunities for developing evidence-based European policies on Inclusive Growth www.inclusivegrowth.eu Title/date 4
About InGRID2 - Organization 19 partners in a consortium Clustered in 2 pillars and 3 themes: Pillars: Poverty and living conditions & Working conditions and vulnerability Themes: Data integration & harmonization, Evaluation & analysis tools, indicator building 4 types of activities: Summer schools & expert workshops & network activities Visiting grants to data infrastructures Joint research activities E-portal www.inclusivegrowth.eu 5 5
Session 1: The WageIndicator Kea Tijdens, Martin Kahanec, Brian Fabo & Stephanie Steinmetz www.inclusivegrowth.eu Title/date 6
How to deal with biases in volunteer web surveys? Some explorations for the Netherlands Stephanie Steinmetz Steinmetz, S.; A. Bianchi, S. Biffigandi; K. Tijdens (2014): Improving web survey quality - Potentials and constraints of propensity score weighting (chapter 12, pp. 273-298). Callegaro, M., R. Baker, J. Bethlehem, A. G ritz, J. Krosnick, P. Lavrakas (Hrsg.): Online Panel research: A Data Quality Perspective. Series in Survey Methodology, Wiley. www.inclusivegrowth.eu Title/date 7
What is the problem? AAPOR Report on Online Panels (2010) Researchers should avoid non-probability online panels when one of the research objectives is to accurately estimate population values. [...] Thus, claims of representativeness should be avoided when using these sample sources. www.inclusivegrowth.eu 8 8
Objectives Wages: central for socio-economic research Wage data collection is challenging (admin. or survey data) Central questions: Are wages collected via a (volunteer) web survey representative for a selected target population? If not how can representativeness be achieved? www.inclusivegrowth.eu 9
(Volunteer) web surveys Advantages (time & cost reduction, interactivity, flexibility, worldwide coverage, interviewer influence (-)) Disadvantages People with web access volunteer/ opt-in (respondents have an unknown selection probability) Representativeness? can web survey estimates be generalised to the target population? Various meanings: representativeness (Kruskal & Mosteller,1979) Sample data gain validity in relation to target population they are meant to represent www.inclusivegrowth.eu 10
Sources of errors in a (web) survey Coverage: number of people having internet access + differences between persons with & without internet. Sampling/self-selection: no comprehensive list of Internet users to draw probability-based sample + people with specific characteristics participate in a (volunteer) web survey. Non-response: not all persons finish questionnaire, people with specific characteristics might have higher non-response. + Measurement errors and processing errors www.inclusivegrowth.eu 11 11
Can weighting solve the problem? www.inclusivegrowth.eu 12
Reasons for weighting In general Adjusts for unequal probabilities of selection Adjusts for nonresponse Improves precision of survey estimator (variance reduction) using auxiliary information (Bias of unweighted estimator = difference between sample & target population) In particular for web surveys Adjusts for under coverage & self selection www.inclusivegrowth.eu 13
Calibration, post-stratification, raking etc. Corrects for mainly for socio-demographic differences between sample & target population (Loosvelt & Sonck 2008, Steinmetz et al. 2013) Limited impact corrects for proportionality but not necessarily for representativeness Yeager et. al. (2011) comparison Average absolute error for 13 secondary demographics and non-demographics, (weighted) www.inclusivegrowth.eu 14
Propensity score adjustment (PSA) Origin: experimental studies (Rosenbaum & Rubin, 1983), use of propensity score for group comparisons Principle idea: Achieve representativity through a representative reference survey & model self-selection of respondents into web survey (PS=likelihood that a respondent participates in web rather than reference survey) BUT: Relies on strong requirements Findings: non conclusive (e.g. Valliant & Dever, 2011) www.inclusivegrowth.eu 15
Application Unique data Dutch LW (non-probability, Oct.-Dec. 2009, N = 1693) LISS panel (probability-based, Oct. 2009, N = 1063) Population information (CBS, 2009) Both data sets (LISS & LW) Identical questionnaires & same mode (Internet) Variety of 8 webographic questions Allow to apply a better exploration of sample biases (PI, LISS, LW) several calibration weights (using PI) 4 weights several PSA weights 12 weights How selective is the data? www.inclusivegrowth.eu 16
Average Relative Differences between CBS & LW + CBS & LISS CBS-LW 0.61 0.30 0.28 0.27 0.17 0.16 0.06 Variable Working Time Sector Age Education Occupation Gender Type of contract CBS-LISS 0.46 0.15 0.32 0.28 0.30 0.07 0.31 www.inclusivegrowth.eu 17
Bias: mean monthly gross wage Scientific Scientific Scientific Scientific High-level High-level High-level High-level Occupat. Occupat. Occupat. Occupat. Medium-level Medium-level Medium-level Medium-level Low-level Low-level Low-level Low-level Elementary Elementary Elementary Elementary Contract Contract Contract Contract Temporary Temporary Temporary Temporary Permanent Permanent Permanent Permanent HObachelor/Master/PhD HObachelor/Master/PhD HObachelor/Master/PhD HObachelor/Master/PhD VO high VO high VO high VO high Edu. Edu. Edu. Edu. LISS-CBS VO low VO low VO low VO low LW-CBS LW-CBS No basic No basic No basic No basic 55-64 55-64 55-64 55-64 45-54 45-54 45-54 45-54 Age Age Age Age 35-44 35-44 35-44 35-44 25-34 25-34 25-34 25-34 15-24 15-24 15-24 15-24 Women Women Women Women Gender In comparison to population, both surveys show wage bias! Gender Gender Gender Men Men Men Men Tota Tota Tota Tota l l l l www.inclusivegrowth.eu 18 400 -200 0 0 200 200 400 600 600 800 800 1000 1000 1200 1200 1400
Weighting strategy Linear weighting & ratio raking IDEA: assign weights such that weighted sample resembles population (for selected covariates) if there is a strong relationship between covariates & target variable estimates will improve! Variables: working time, sector, gender, education, age Propensity score adjustment (PSA) LISS serves as reference survey (adjusted) PS=likelihood that a unit participates in LW rather than LISS IDEA: give higher weights to those who are less likely to partcipate in the LW 4 traditional & 12 PS weights www.inclusivegrowth.eu 19
Results adjustment of mean wages LW PS.C.4 LW PS.B.4 LW PS.C.4 LW PS.C.4 LW PS.B.4 LW PS.A.4 LW PS.B.4 LW PS.A.4 LW PS.C.3 LW PS.A.4 LW PS.C.3 LW PS.B.3 LW PS.C.3 LW PS.B.3 LW PS.A.3 LW PS.B.3 LW PS.A.3 LW PS.C.2 LW PS.A.3 LW PS.C.2 LW PS.B.2 LW PS.C.2 LW PS.B.2 LW PS.A.2 LW PS.B.2 LW PS.A.2 LW PS.C.1 LW PS.A.2 LW PS.C.1 LW PS.B.1 LW PS.C.1 LW PS.B.1 LW PS.A.1 LW PS.B.1 LW PS.A.1 LW CAL.4 LW PS.A.1 LW CAL.4 LW CAL.3 LW CAL.4 LW CAL.3 LW CAL.2 LW CAL.3 LW CAL.2 LW CAL.1 LW CAL.2 LW CAL.1 LW unweighted LW CAL.1 LW unweighted LISS weighted LW unweighted LISS weighted Population LISS weighted Population Population 0 500 1000 1500 2000 2500 3000 3500 4000 0 500 1000 1500 2000 2500 3000 3500 4000 0 500 1000 1500 2000 2500 3000 3500 4000 www.inclusivegrowth.eu 20
In sum Use of PSA can help to reduce biases of a volunteer web survey (mean monthly wage in LW). But: - most efficient PS type (ungrouped) shows greatest variability requires further adaptions (trimming etc.)! - detailed by groups, improvements for all covariates but work not homogenous within PS weight Set of webographics does not increase efficency. www.inclusivegrowth.eu 21
To weight or not to weight that is the question What have we learned? www.inclusivegrowth.eu 22 22
PSA can work if we have a proper reference survey we have meaningful covariates (also webographics) we can exclude mode effect, we have the same questionnaire, we have ignorable non-response Very strong requirements ! www.inclusivegrowth.eu 23
Challenges Requirements are rarely fulfilled ! Success dependent on pre-selection conditions Population information difficult to access (one country!) Definition of the target variable Missings on core variables (systematic?) How to deal with a biased reference survey? Reduction of estimation biases often causes higher variance Attitudinal questions are less reliable (might depend on current circumstances, vary over time) measurement error www.inclusivegrowth.eu 24
Is there a future for volunteer web surveys? Possible solutions for representativeness: Improving weights (imputation, better model specification, complex weighting adjustments) Only mixed-mode surveys (time & cost-reduction disappears) Non-representative use of volunteer web survey data (only for explorative analysis) OR Discuss meaning representativeness Survey quality absolute assess quality of non-probability samples (see AAPOR report 2013) Transparency is important www.inclusivegrowth.eu 25
Representativeness of surveys AAPOR Report on Online Panels (2010) However, at the same time There are times when a non-probability online panel is an appropriate choice. [ ] there may be survey purposes and topics where the generally lower cost and unique properties of Source: Fabo, B. (2017), p. 47 Web data collection is an acceptable alternative to traditional probability-based methods. www.inclusivegrowth.eu 26
Thank you for your attention! Contact: s.m.steinmetz@uva.nl Co-ordinator For more information on WageIndicator: www.wageindicator.org Guy Van Gyes InGRID-2 Partners Integrating Research Infrastructure for European expertise on Inclusive Growth from data to policy Contract N 730998 T RKI Social Research Institute Inc. (HU) Amsterdam Institute for Advanced Labour Studies AIAS, University of Amsterdam (NL) Swedish Institute for Social Research - SOFI, Stockholm University (SE) Economic and Social Statistics Department, Trier University (DE) Centre for Demographic Studies CED, University Autonoma of Barcelona (ES) Luxembourg Institute of Socio-Economic Research LISER (LU) Herman Deleeck Centre for Social Policy CSB, University of Antwerp (BE) Institute for Social and Economic Research - ISER, University of Essex (UK) German Institute for Economic Research DIW (DE) Centre for Employment and Work Studies CEET, National Conservatory of Arts and Crafts (FR) Centre for European Policy Studies CEPS (BE) Department of Economics and Management, University of Pisa (IT) Department of Social Statistics and Demography SOTON, University of Southampton (UK) Luxembourg Income Study LIS, asbl (LU) School of Social Sciences, University of Manchester (UK) Central European Labour Studies Institute CELSI (SK) Panteion University of Social and Political Sciences (GR) Central Institute for Labour Protection CIOP, National Research Institute (PL) For further information about the InGRID-2 project, please contact inclusive.growth@kuleuven.be www.inclusivegrowth.eu p/a HIVA Research Institute for Work and Society Parkstraat 47 box 5300 3000 Leuven Belgium
Coffee Break - Let s take a group picture & start networking! www.inclusivegrowth.eu Title/date 28
Session 2: Roundtable discussion Ulrich Kohler & Sander Stijn www.inclusivegrowth.eu Title/date 29
References Bandilla, W., Bosnjak, M. & Altdorfer, P. (2003). Survey administration effects? A comparison of web-based and traditional written self-administered surveys using the ISSP environment module. Social Science Computer Review, 21, 235-243; Bethlehem, J. (2010). Selection Bias in Web Surveys. International Statistical Review, 78, 161-188. Bethlehem, J. & Stoop, I. (2007). Online panels - a paradigm theft? In M. Trotman et al. (Eds.), The challenges of a changing world (pp. 113-131). Proceedings of the 5thInternational Conference of the Association for Survey Computing. Southampton: Association for Survey Computing. Duffy, B., Smith, K., Terhanian, G. & Bremer, J. (2005). Comparing data from online and face-to-face surveys. International Journal of Market Research, 47, 615-639 Kruskal & Mosteller,1979 Loosveldt, G. & Sonck, N. (2008). An evaluation of the weighting procedures for online access panel surveys. Survey Research Methods, 2, 93-105. Rosenbaum, P. & Rubin, D. (1983). The central role of the propensity score in observational studies for causal effects. Biometrika, 70, 41-55. Schonlau, M., van Soest, A., Kapteyn, A. & Couper, M. (2009). Selection bias in web surveys and the use of propensity scores. Sociological Methods Research, 37, 291-318. Steinmetz, S., D. Raess, P. de Pedraza, K. Tijdens (2013): Measuring wages worldwide - exploring the potentials and constraints of volunteer web surveys (chapter 6, pp.100-119). Sappleton, N. (Hrsg.): Advancing Social and Business Research Methods with New Media Technologies. Hershey, PA: IGI Global. Steinmetz, S.; A. Bianchi, S. Biffigandi; K. Tijdens (2014): Improving web survey quality - Potentials and constraints of propensity score weighting (chapter 12, pp. 273-298). Callegaro, M., R. Baker, J. Bethlehem, A. G ritz, J. Krosnick, P. Lavrakas (Hrsg.): Online Panel research: A Data Quality Perspective. Series in Survey Methodology, Wiley. Taylor, H. (2005). Does Internet research work ? Comparing online survey results with telephone surveys. International Journal of Market Research, 42, 51-63 Valliant, R. & Dever, J. (2011). Estimating propensity adjustments for volunteer web surveys. Sociological Methods, 40, 105- 137. Yeager, D.S., Krosnick, J.A., Chang, L., Javitz, H.S., Levendusky, M.S., Simpser, A. & Wang, R. (2011). Comparing the accuracy of RDD telephone surveys and Internet surveys conducted with probability and non-probability samples. Public Opinion Quarterly, 75, 709-747. www.inclusivegrowth.eu 30


