Challenges in HIV Transmission Control in Indiana Outbreak
Injection drug use remains a persistent challenge in controlling HIV transmission, as highlighted by the Indiana outbreak. Dr. John T. Brooks addresses the changing patterns of injection drug use in the United States and the impact on new HIV diagnoses. The data presented shows the ongoing struggle in responding to rural outbreaks of HIV infections among drug users in a comprehensive manner.
Download Presentation

Please find below an Image/Link to download the presentation.
The content on the website is provided AS IS for your information and personal use only. It may not be sold, licensed, or shared on other websites without obtaining consent from the author.If you encounter any issues during the download, it is possible that the publisher has removed the file from their server.
You are allowed to download the files provided on this website for personal or commercial use, subject to the condition that they are used lawfully. All files are the property of their respective owners.
The content on the website is provided AS IS for your information and personal use only. It may not be sold, licensed, or shared on other websites without obtaining consent from the author.
E N D
Presentation Transcript
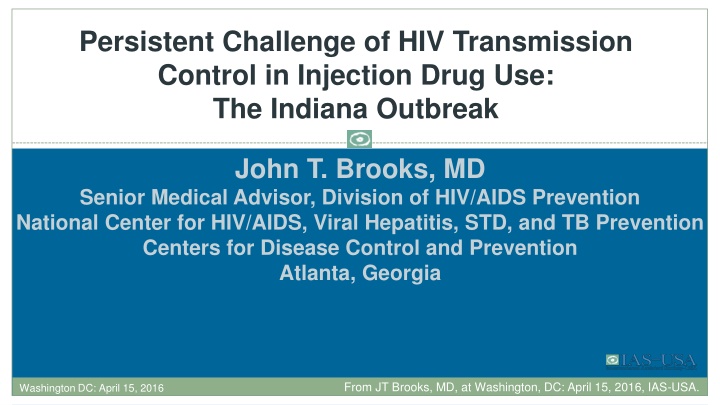
Persistent Challenge of HIV Transmission Control in Injection Drug Use: The Indiana Outbreak John T. Brooks, MD Senior Medical Advisor, Division of HIV/AIDS Prevention National Center for HIV/AIDS, Viral Hepatitis, STD, and TB Prevention Centers for Disease Control and Prevention Atlanta, Georgia FINAL: 04/11/2016 From JT Brooks, MD, at Washington, DC: April 15, 2016, IAS-USA. Washington DC: April 15, 2016
Learning Objectives After attending this presentation, participants will be able to: Characterize the challenges faced when responding to a rural outbreak of HIV infection among persons who inject drugs Describe how patterns of injection drug use are changing in the United States From JT Brooks, MD, at Washington, DC: April 15, 2016, IAS-USA. Slide 2 of 51
In 2014, what fraction of new HIV diagnoses were estimated as attributable to injection drug use: 1. 1. 24% 2. 2. 18% 3. 3. 12% 4. 4. 6% 25% 36% 29% 11% Slide 3 of 51
In the last 5 years, the number of new HIV diagnoses estimated as attributable to injection drug use has been: 1. Stable 2. Declining 3. Rising 4. All over the place 21% 25% 43% 11% Slide 4 of 51
Slide 5 of 51 Number of HIV Infections Diagnosed among Number of HIV Infections Diagnosed among Adults and Adolescents by Transmission Category, by Transmission Category, 2005 2005 2014 2014 - - United Adults and Adolescents, , United States and 6 Dependent Areas States and 6 Dependent Areas Male-to-male sexual contact 30,000 25,000 Diagnoses, n 63% decline over 10 years 6% of all HIV infections in 2014 20,000 Heterosexual contact 15,000 10,000 6,408 Injection drug use 2,364 5,000 0 2005 2006 2007 2008 2009 Year 2010 2011 2012 2013 2014 From JT Brooks, MD, at Washington, DC: April 15, 2016, IAS-USA.
Slide 6 of 51 From JT Brooks, MD, at Washington, DC: April 15, 2016, IAS-USA.
Slide 7 of 51 Indiana HIV Outbreak: Geography Scott County pop. 24,000; Austin city pop. 4,200 Rural southeastern region of state Scott County ranked 92nd in many health and social indicators among Indiana s 92 counties Lowest life expectancy 9% unemployment 19% poverty 21% no high school Many uninsured From JT Brooks, MD, at Washington, DC: April 15, 2016, IAS-USA.
Slide 8 of 51 Indiana HIV Outbreak Summary In early 2015, 11 new HIV infections diagnosed in Scott County, IN Over past decade, <1 HIV new infection in Scott County per year As of February 1, 2016 188 new HIV diagnosis >90% coinfected with hepatitis C virus Response required a large and intensive collaboration of local, state and federal public health resources in partnership with the community Establish extent of the HIV infections Institute prevention and control measures Transmissions occurred in a dense network of persons who inject drugs Opioid analgesic oxymorphone From JT Brooks, MD, at Washington, DC: April 15, 2016, IAS-USA.
Slide 9 of 51 Demographics of HIV-infected Cases (N=181) Median age 34 years, interquartile range 28 - 42 58% male 99% non-Hispanic white 96% injected drugs in past 12 months From JT Brooks, MD, at Washington, DC: April 15, 2016, IAS-USA. Peters P et al., in press
Slide 10 of 51 Diagnoses of HIV Infection Among Persons Who Inject Drugs by Sex and Race/Ethnicity, 2014 United States and 6 Dependent Areas Males N = 1,672 Females N = 1,060 4% 4% Historical demography Mostly urban Male > female Mostly non-white 27% 41% 34% 43% 28% Black, African-American Hispanic/Latinoa White 19% Other Note. Data include persons with a diagnosis of HIV infection regardless of stage of disease at diagnosis. All displayed data have been statistically adjusted to account for reporting delays, but not for incomplete reporting. a Hispanics/Latinos can be of any race. From JT Brooks, MD, at Washington, DC: April 15, 2016, IAS-USA.
Slide 11 of 51 Diagnoses of HIV Infection Among Persons Who Inject Drugs by Sex and Race/Ethnicity, 2014 United States and 6 Dependent Areas Males N = 1,672 Females N = 1,060 Historical demography Mostly urban Male > female Mostly non-white 69% 62% Black, African-American Hispanic/Latino White Other Note. Data include persons with a diagnosis of HIV infection regardless of stage of disease at diagnosis. All displayed data have been statistically adjusted to account for reporting delays, but not for incomplete reporting. a Hispanics/Latinos can be of any race. From JT Brooks, MD, at Washington, DC: April 15, 2016, IAS-USA.
Slide 12 of 51 Demographics of HIV-infected Cases (N=181) Median age 34 years, interquartile range 28 - 42 58% male 99% non-Hispanic white 96% injected drugs in past 12 months 92% oxymorphone 27% heroin, 23% methamphetamine, 9% cocaine From JT Brooks, MD, at Washington, DC: April 15, 2016, IAS-USA. Peters P et al., in press
Slide 13 of 51 Drug Use among HIV-infected Cases (N=108) Multigenerational users Daily injections: 4-15 Number of needle-sharing partners per injection event: 1-6 Sharing of injection equipment common Oxymorphone ER with INTAC Tablet Images* GENERIC oxymorphone ER Tablet Images* From JT Brooks, MD, at Washington, DC: April 15, 2016, IAS-USA. Early Release, MMWR Morb Mortal Wkly Report 2015, April 24, 2015
Slide 14 of 51 HIV Diagnoses by Week, Indiana HIV Outbreak (N=188) Detect and confirm 25 HIV Diagnoses per Week 20 15 10 5 0 1-Feb 8-Feb 6-Sep 5-Apr 12-Apr 19-Apr 26-Apr 2-Aug 9-Aug 15-Feb 22-Feb 1-Mar 8-Mar 3-May 16-Aug 23-Aug 30-Aug 13-Sep 20-Sep 27-Sep 4-Jan 11-Jan 18-Jan 25-Jan 3-Jan 10-Jan 17-Jan 24-Jan 31-Jan 16-Nov 23-Nov 30-Nov 15-Mar 22-Mar 29-Mar 10-May 17-May 24-May 31-May 1-Nov 8-Nov 15-Nov 22-Nov 29-Nov 7-Jun 14-Jun 21-Jun 28-Jun 5-Jul 12-Jul 19-Jul 26-Jul 7-Dec 14-Dec 21-Dec 28-Dec 6-Dec 13-Dec 20-Dec 27-Dec 4-Oct 11-Oct 18-Oct 25-Oct Week Ending Peters P et al., in press and Indiana State Department of Health From JT Brooks, MD, at Washington, DC: April 15, 2016, IAS-USA.
Slide 15 of 51 HIV Diagnoses by Week, Indiana HIV Outbreak (N=188) Deploy emergency command, HIV testing, contact tracing, services Detect and confirm 25 HIV Diagnoses per Week Jail-based testing: local and sentinel Teams of disease intervention specialists Point-of-care rapid test Venous blood draw (e.g., confirmation, acute HIV, HCV) Provided prevention education Directed to services: Treatment antiretroviral therapy Prevention addiction and harm reduction, PrEP 20 15 10 5 0 1-Feb 8-Feb 6-Sep 5-Apr 12-Apr 19-Apr 26-Apr 2-Aug 9-Aug 15-Feb 22-Feb 1-Mar 8-Mar 3-May 16-Aug 23-Aug 30-Aug 13-Sep 20-Sep 27-Sep 4-Jan 11-Jan 18-Jan 25-Jan 3-Jan 10-Jan 17-Jan 24-Jan 31-Jan 16-Nov 23-Nov 30-Nov 15-Mar 22-Mar 29-Mar 10-May 17-May 24-May 31-May 1-Nov 8-Nov 15-Nov 22-Nov 29-Nov 7-Jun 14-Jun 21-Jun 28-Jun 5-Jul 12-Jul 19-Jul 26-Jul 7-Dec 14-Dec 21-Dec 28-Dec 6-Dec 13-Dec 20-Dec 27-Dec 4-Oct 11-Oct 18-Oct 25-Oct Week Ending Peters P et al., under review and Indiana State Department of Health From JT Brooks, MD, at Washington, DC: April 15, 2016, IAS-USA.
Slide 16 of 51 HIV Diagnoses by Week, Indiana HIV Outbreak (N=188) Consolidate case management, HIV treatment, prevention services Deploy emergency command, HIV testing, contact tracing, services Detect and confirm 25 HIV Diagnoses per Week 20 15 10 5 0 1-Feb 8-Feb 6-Sep 5-Apr 12-Apr 19-Apr 26-Apr 2-Aug 9-Aug 15-Feb 22-Feb 1-Mar 8-Mar 3-May 16-Aug 23-Aug 30-Aug 13-Sep 20-Sep 27-Sep 4-Jan 11-Jan 18-Jan 25-Jan 3-Jan 10-Jan 17-Jan 24-Jan 31-Jan 16-Nov 23-Nov 30-Nov 15-Mar 22-Mar 29-Mar 10-May 17-May 24-May 31-May 1-Nov 8-Nov 15-Nov 22-Nov 29-Nov 7-Jun 14-Jun 21-Jun 28-Jun 5-Jul 12-Jul 19-Jul 26-Jul 7-Dec 14-Dec 21-Dec 28-Dec 6-Dec 13-Dec 20-Dec 27-Dec 4-Oct 11-Oct 18-Oct 25-Oct Week Ending Peters P et al., under review and Indiana State Department of Health From JT Brooks, MD, at Washington, DC: April 15, 2016, IAS-USA.
Slide 17 of 51 HIV Diagnoses by Week, Indiana HIV Outbreak (N=188) Consolidate case management, HIV treatment, prevention services Deploy emergency command, HIV testing, contact tracing, services Retesting blitz Detect and confirm 25 HIV Diagnoses per Week 20 15 10 5 0 1-Feb 8-Feb 6-Sep 5-Apr 12-Apr 19-Apr 26-Apr 2-Aug 9-Aug 15-Feb 22-Feb 1-Mar 8-Mar 3-May 16-Aug 23-Aug 30-Aug 13-Sep 20-Sep 27-Sep 4-Jan 11-Jan 18-Jan 25-Jan 3-Jan 10-Jan 17-Jan 24-Jan 31-Jan 16-Nov 23-Nov 30-Nov 15-Mar 22-Mar 29-Mar 10-May 17-May 24-May 31-May 1-Nov 8-Nov 15-Nov 22-Nov 29-Nov 7-Jun 14-Jun 21-Jun 28-Jun 5-Jul 12-Jul 19-Jul 26-Jul 7-Dec 14-Dec 21-Dec 28-Dec 6-Dec 13-Dec 20-Dec 27-Dec 4-Oct 11-Oct 18-Oct 25-Oct Week Ending Peters P et al., under review and Indiana State Department of Health From JT Brooks, MD, at Washington, DC: April 15, 2016, IAS-USA.
Slide 18 of 51 HIV Diagnoses by Week, Indiana HIV Outbreak (N=188) Consolidate case management, HIV treatment, prevention services Deploy emergency command, HIV testing, contact tracing, services Retesting blitz Detect and confirm 25 HIV Diagnoses per Week 20 Adult prevalence as of February 1, 2016 15 Austin, if home for 80% of cases (3,143*): 4.6 % Scott County (18,264*): 1.0 % 10 5 0 1-Feb 8-Feb 6-Sep 5-Apr 12-Apr 19-Apr 26-Apr 2-Aug 9-Aug 15-Feb 22-Feb 1-Mar 8-Mar 3-May 16-Aug 23-Aug 30-Aug 13-Sep 20-Sep 27-Sep 4-Jan 11-Jan 18-Jan 25-Jan 3-Jan 10-Jan 17-Jan 24-Jan 31-Jan 16-Nov 23-Nov 30-Nov 15-Mar 22-Mar 29-Mar 10-May 17-May 24-May 31-May 1-Nov 8-Nov 15-Nov 22-Nov 29-Nov 7-Jun 14-Jun 21-Jun 28-Jun 5-Jul 12-Jul 19-Jul 26-Jul 7-Dec 14-Dec 21-Dec 28-Dec 6-Dec 13-Dec 20-Dec 27-Dec 4-Oct 11-Oct 18-Oct 25-Oct Week Ending Peters P et al., under review and Indiana State Department of Health *estimated population age >18 years, U.S. Census From JT Brooks, MD, at Washington, DC: April 15, 2016, IAS-USA.
Slide 19 of 51 HIV Diagnoses by Week, Indiana HIV Outbreak (N=188) Consolidate case management, HIV treatment, prevention services Deploy emergency command, HIV testing, contact tracing, services Retesting blitz Detect and confirm 25 HIV Diagnoses per Week 20 Declined earlier testing Finally came in for testing or diagnosed at incarceration 15 10 5 0 1-Feb 8-Feb 6-Sep 5-Apr 12-Apr 19-Apr 26-Apr 2-Aug 9-Aug 15-Feb 22-Feb 1-Mar 8-Mar 3-May 16-Aug 23-Aug 30-Aug 13-Sep 20-Sep 27-Sep 4-Jan 11-Jan 18-Jan 25-Jan 3-Jan 10-Jan 17-Jan 24-Jan 31-Jan 16-Nov 23-Nov 30-Nov 15-Mar 22-Mar 29-Mar 10-May 17-May 24-May 31-May 1-Nov 8-Nov 15-Nov 22-Nov 29-Nov 7-Jun 14-Jun 21-Jun 28-Jun 5-Jul 12-Jul 19-Jul 26-Jul 7-Dec 14-Dec 21-Dec 28-Dec 6-Dec 13-Dec 20-Dec 27-Dec 4-Oct 11-Oct 18-Oct 25-Oct Week Ending Peters P et al., under review and Indiana State Department of Health From JT Brooks, MD, at Washington, DC: April 15, 2016, IAS-USA.
Slide 20 of 51 Laboratory Investigation, 2015 Indiana HIV Outbreak Phylogenetic Analysis of pol Sequences and Recency Testing* SOURCE OF SAMPLE Indiana outbreak investigation Indiana reference sample (non-outbreak related) GenBank reference Single strain of HIV-1 Mean nucleotide identity 99.7% (1302 base pairs) No antiretroviral drug resistance detected All infections epidemiologically linked to Scott County Availability of near real-time pol sequencing confirmed limited geographic spread of outbreak* 157 isolates *Poster 215: Campbell et al., Infer and characterize a transmission network in an opioid-driven HIV-1 outbreak From JT Brooks, MD, at Washington, DC: April 15, 2016, IAS-USA.
Slide 21 of 51 Laboratory Investigation, 2015 Indiana HIV Outbreak Phylogenetic Analysis of pol Sequences and Recency Testing* SOURCE OF SAMPLE Indiana outbreak investigation Indiana reference sample (non-outbreak related) GenBank reference Single strain of HIV-1 Mean nucleotide identity 99.7% (1302 base pairs) No antiretroviral drug resistance detected All infections epidemiologically linked to Scott County Availability of near real-time pol sequencing confirmed limited geographic spread of outbreak 85% of infections recent* (limited in time) 157 isolates * Recency testing was performed using a Modified BioRad 1/2 Plus O Assay with avidity index cutoff set at 30%, corresponding to approximately 221 days From JT Brooks, MD, at Washington, DC: April 15, 2016, IAS-USA.
Slide 22 of 51 Major Logistical Challenges Responding to Outbreak Very few affected persons were employed or insured Lacked documents* to enroll in state-supported program ( One-Stop Shop ) Limited HIV awareness, substantial misinformation Unaware of transmission risks and treatment benefits Distrust between PWID community and law enforcement No outpatient HIV/HCV care available in the community Insufficient addiction services, including medication-assisted therapy Syringe service program not permitted by state law * Birth certificate, driver s license, Social Security card From JT Brooks, MD, at Washington, DC: April 15, 2016, IAS-USA.
Slide 23 of 51 Emergency Declaration and New Law Permitted Syringe Exchange in Response to Outbreak http://ohioaidscoalition.org/wp-content/uploads/OAC-Policy-Update-5_8_15.pdf From JT Brooks, MD, at Washington, DC: April 15, 2016, IAS-USA.
Slide 24 of 51 From JT Brooks, MD, at Washington, DC: April 15, 2016, IAS-USA.
Slide 25 of 51 Federal funds can be used for syringe service programs (except purchase of needles and syringes) if in consultation with CDC a need is demonstrated (i.e., significant increase in hepatitis infections, HIV outbreak) From JT Brooks, MD, at Washington, DC: April 15, 2016, IAS-USA.
Slide 26 of 51 Impact of Syringe Exchange in Scott County Reductions in sharing syringes and injection equipment (n=148) p <0.001 p <0.001 p <0.001 30% 24% 19% 18% 20% 10% 5% 4% 2% 0% Sharing syringes to inject Sharing syringes to divide drugs Sharing other injection equipment (median 10 weeks after first visit) First visit Most recent visit Patel et al. IDWeek 2015, abstract: Open Forum Infect Dis (Fall 2015) 2 (supplement 1): S69-S70 From JT Brooks, MD, at Washington, DC: April 15, 2016, IAS-USA.
Slide 27 of 51 Why Did this Event Happen? From JT Brooks, MD, at Washington, DC: April 15, 2016, IAS-USA.
Slide 28 of 51 What Had Changed? From JT Brooks, MD, at Washington, DC: April 15, 2016, IAS-USA.
Slide 29 of 51 Time Magazine, June 15, 2015 From JT Brooks, MD, at Washington, DC: April 15, 2016, IAS-USA.
Slide 30 of 51 Rates of motor vehicle traffic and drug overdose deaths, United States 1980-2010 Source: DHHS, Addressing Prescription Drug Abuse in the United States Current Activities and Future Opportunities , September 2013 * From JT Brooks, MD, at Washington, DC: April 15, 2016, IAS-USA.
Slide 31 of 51 Rates of motor vehicle traffic and drug overdose deaths, United States 1980-2010 2014 47,055 * 32,675 ** Source: DHHS, Addressing Prescription Drug Abuse in the United States Current Activities and Future Opportunities , September 2013 * MMWR Wkly Rep 2016, 64(50): 1378-82 **http://www-nrd.nhtsa.dot.gov/Pubs/812219.pdf From JT Brooks, MD, at Washington, DC: April 15, 2016, IAS-USA.
Slide 32 of 51 Rates of motor vehicle traffic and drug overdose deaths, United States 1980-2010 1999: Opioids involved: 30% of drug overdoses Source: DHHS, Addressing Prescription Drug Abuse in the United States Current Activities and Future Opportunities , September 2013 * From JT Brooks, MD, at Washington, DC: April 15, 2016, IAS-USA.
Slide 33 of 51 Rates of motor vehicle traffic and drug overdose deaths, United States 1980-2010 2010: Opioids involved: 60% of drug overdoses 1999: Opioids involved: 30% of drug overdoses Source: DHHS, Addressing Prescription Drug Abuse in the United States Current Activities and Future Opportunities , September 2013 * From JT Brooks, MD, at Washington, DC: April 15, 2016, IAS-USA.
Slide 34 of 51 Rates of opioid overdose deaths, opioid sales, and opioid substance abuse treatment admissions, United States Source: DHHS, Addressing Prescription Drug Abuse in the United States Current Activities and Future Opportunities , September 2013 From JT Brooks, MD, at Washington, DC: April 15, 2016, IAS-USA.
Slide 35 of 51 Rates of opioid overdose deaths, opioid sales, and opioid substance abuse treatment admissions, United States Increasing opioid use Increasing injection of drugs From JT Brooks, MD, at Washington, DC: April 15, 2016, IAS-USA. Source: DHHS, Addressing Prescription Drug Abuse in the United States Current Activities and Future Opportunities , September 2013
Slide 36 of 51 Rapid expansion of injection drug use heralded by epidemic of new HCV infections in areas with historically low rates of HIV infection 2006 2006 2012 2012 Acute HCV infections incidence per 100,000 population Acute HCV infections incidence per 100,000 population 0-1 >1-10 >10-20 >20-40 >40 0-1 >1-10 >10-20 >20-40 >40 Suryaprasad Clin Infect Dis; 2014, 59(10):1411-1419 From JT Brooks, MD, at Washington, DC: April 15, 2016, IAS-USA.
Slide 37 of 51 Rapid expansion of injection drug use heralded by epidemic of new HCV infections in areas with historically low rates of HIV infection 2006 2012 Acute HCV infections incidence per 100,000 population Acute HCV infections incidence per 100,000 population 0-1 >1-10 >10-20 >20-40 >40 0-1 >1-10 >10-20 >20-40 >40 Suryaprasad Clin Infect Dis; 2014, 59(10):1411-1419 From JT Brooks, MD, at Washington, DC: April 15, 2016, IAS-USA.
Slide 38 of 51 Rapid expansion of injection drug use heralded by epidemic of new HCV infections in areas with historically low rates of HIV infection Kentucky, Tennessee, Virginia, West Virginia Incidence nonurban more than twice urban, and increasing faster 4 Number of cases per 100,000 population Nonurban areas Urban areas 3 2 1 0 2012 2010 2011 2006 2008 2009 2007 Zibbell J et al. MMWR Morb Mortal Wkly Rep 2015, 64(17): 444-448, From JT Brooks, MD, at Washington, DC: April 15, 2016, IAS-USA.
Slide 39 of 51 Needle and Syringe Programs Reduce HIV Incidence 56% reduction in risk of HIV infection Aspinall E J et al. Int J. Epidemiolog. 2014, Courtesy of Richard Needle From JT Brooks, MD, at Washington, DC: April 15, 2016, IAS-USA.
Slide 40 of 51 Opioid Substitution Therapy Reduces HIV Transmission 64% reduction in risk of HIV infection MacArthur G J et al. BMJ 2012, Courtesy of Richard Needle From JT Brooks, MD, at Washington, DC: April 15, 2016, IAS-USA.
Slide 41 of 51 Explosive Increases in HIV Prevalence among PWID, 1978-1998 40% and higher prevalence may be reached within 1-2 years 100 New? York,? USA Edinburgh,? Scotland 80 HIV? prevalence? (%) Bangkok,? Thailand Chiang? Rai,? Thailand 60 Ruili,? China Manipur,? India 40 Ho? Chi? Minh,? Vietnam Kathmandu,? Nepal 20 Nikolaev,? Ukraine? Odessa,? Ukraine? 0 1977 1978 1979 1980 1981 1982 1983 1984 1985 1986 1987 1988 1989 1990 1991 1992 1993 1994 1995 1996 1997 1998 UN Reference Group on HIV/AIDS Prevention and Care among IDU in Developing and Transitional Countries, www.idurefgroup.org, Courtesy of Richard Needle From JT Brooks, MD, at Washington, DC: April 15, 2016, IAS-USA.
Slide 42 of 51 What can we do? Assess and reduce vulnerability to an outbreak Determine if unsafe injection of drugs is occurring Employ syringe service programs Diagnose and treat substance use disorder Enhance capacity to detect a change in HIV and HCV infections Test at drug treatment service sites, jails/prisons, hospitals Prepare an action plan in the event of an outbreak Delineate landscape of HIV/HCV prevention and treatment Establish relationships with local law enforcement From JT Brooks, MD, at Washington, DC: April 15, 2016, IAS-USA.
Slide 43 of 51 Lessons from Indiana The U.S. is experiencing an expanding prescription drug and heroin epidemic that is driving increases in injection drug use From JT Brooks, MD, at Washington, DC: April 15, 2016, IAS-USA.
Slide 44 of 51 Lessons from Indiana The U.S. is experiencing an expanding prescription drug and heroin epidemic that is driving increases in injection drug use A new and growing group of U.S. residents has become vulnerable to potentially explosive spread of HIV and HCV infection From JT Brooks, MD, at Washington, DC: April 15, 2016, IAS-USA.
Slide 45 of 51 Lessons from Indiana The U.S. is experiencing an expanding prescription drug and heroin epidemic that is driving increases in injection drug use A new and growing group of U.S. residents has become vulnerable to potentially explosive spread of HIV and HCV infection The events in Indiana were devastating From JT Brooks, MD, at Washington, DC: April 15, 2016, IAS-USA.
Slide 46 of 51 Lessons from Indiana The U.S. is experiencing an expanding prescription drug and heroin epidemic that is driving increases in injection drug use A new and growing group of U.S. residents has become vulnerable to potentially explosive spread of HIV and HCV infection The events in Indiana were devastating but they were preventable From JT Brooks, MD, at Washington, DC: April 15, 2016, IAS-USA.
Slide 47 of 51 Lessons from Indiana The U.S. is experiencing an expanding prescription drug and heroin epidemic that is driving increases in injection drug use A new and growing group of U.S. residents has become vulnerable to potentially explosive spread of HIV and HCV infection The events in Indiana were devastating but they were preventable Other communities are at risk From JT Brooks, MD, at Washington, DC: April 15, 2016, IAS-USA.
Slide 48 of 51 Lessons from Indiana The U.S. is experiencing an expanding prescription drug and heroin epidemic that is driving increases in injection drug use A new and growing group of U.S. residents has become vulnerable to potentially explosive spread of HIV and HCV infection The events in Indiana were devastating but they were preventable Other communities are at risk and the number could grow From JT Brooks, MD, at Washington, DC: April 15, 2016, IAS-USA.
Slide 49 of 51 Lessons from Indiana The U.S. is experiencing an expanding prescription drug and heroin epidemic that is driving increases in injection drug use A new and growing group of U.S. residents has become vulnerable to potentially explosive spread of HIV and HCV infection The events in Indiana were devastating but they were preventable Other communities are at risk and the number could grow It could happen again From JT Brooks, MD, at Washington, DC: April 15, 2016, IAS-USA.
Slide 50 of 51 Lessons from Indiana The U.S. is experiencing an expanding prescription drug and heroin epidemic that is driving increases in injection drug use A new and growing group of U.S. residents has become vulnerable to potentially explosive spread of HIV and HCV infection The events in Indiana were devastating but they were preventable Other communities are at risk and the number could grow It could happen again butit doesn t have to From JT Brooks, MD, at Washington, DC: April 15, 2016, IAS-USA.
