Challenges and Strategies in Mega Projects Management
Mega projects face significant challenges such as delays and cost overruns. Success requires organizational fortitude, risk management, and strategic decision-making. Examples from the energy sector highlight the complexities and importance of addressing these issues effectively to ensure project success.

Download Presentation

Please find below an Image/Link to download the presentation.
The content on the website is provided AS IS for your information and personal use only. It may not be sold, licensed, or shared on other websites without obtaining consent from the author.If you encounter any issues during the download, it is possible that the publisher has removed the file from their server.
You are allowed to download the files provided on this website for personal or commercial use, subject to the condition that they are used lawfully. All files are the property of their respective owners.
The content on the website is provided AS IS for your information and personal use only. It may not be sold, licensed, or shared on other websites without obtaining consent from the author.
E N D
Presentation Transcript
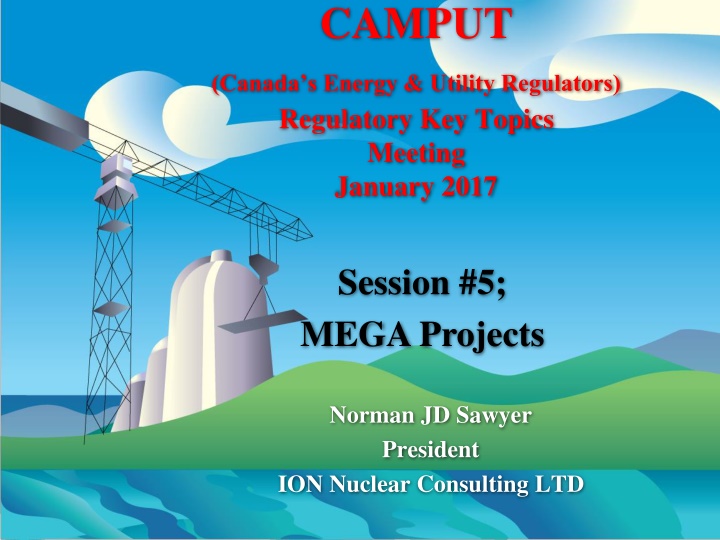
CAMPUT (Canada s Energy & Utility Regulators) Regulatory Key Topics Meeting January 2017 Session #5; MEGA Projects Norman JD Sawyer President ION Nuclear Consulting LTD
Mega projects I would offer that the success of Mega Projects are more than just plans, resources & cost; it is a test of Organization s Fortitude (Resiliency & Engagement)
Mega projects Earnest & Young 2016 analysis of 100 large power generation, Transmission & Distribution and Water Projects World Wide Mega Projects 64% delayed in completion 25 months average delay 57% were over budget 35% average overspend of initial cost estimate North America Mega Power Projects Hydro; ~ 80% over budget & average cost over run of ~60% Nuclear; ~ 60% over budget & average cost over run of ~35% Gas-Fired; ~ 22% over budget & average cost over run of ~10% Canadian Mega Power Projects (Approximate values) Hydro projects Newfoundland (824 MW) ~ $11.4 vs. $7 B Ontario Niagara Tunnel ~ $1.5 vs. $0.98 B Nuclear Projects Ontario two units (1500 MW) ~ $5 vs. $2.75 B New Brunswick single unit (700 MW) ~ $2.4 vs. $1.8 B
Mega projects Costing of USA Major Uprates (Paper Renaissance in Reverse by Marc Cooper, Vermont Law School) NPP Major Uprates Estimated at $1800 to $3500 per kw Actual cost at $3400 to $5800 per kw $ / kw $7,000.00 $6,000.00 $5,000.00 $4,000.00 Initial Estimate Final Cost $3,000.00 $2,000.00 $1,000.00 $0.00 Grand Gulf (Mississippi) Montecello (Minnesota) Florida Power
Organizational Ability to Deal with Risk We Can Do It, is always understood. Should We Do It, sometimes not!
Organizational Ability to Deal with Risk Decreasing Levels of Uncertainty Increasing Levels of Knowledge Various Decision-Making Interventions Cost estimates in $ (Time, Resources, Procurement) + 100% - 50% + 20% - 15% + 5% - 5% Development Phase Execution Phase
Organizational Ability to Deal with Risk Ability to Address Cost Final Investment Decision 100% High Contractor Performance Critical to success Labor is essentially the same Management is the Delta 0% Low Project Cost Front End Design - Procurement Construct & Install
Organizational Ability to Deal with Risk Enterprise Risk Overall Risk Operational Risk Project Risk Organizational ability to understand and manage each risk individually, in various combination and as an overall risk, is an indicator of potential success.
Organizational Ability to Deal with Risk Crystal River Unit #3 Containment Building ANO Stator Drop San Onofre Unit #2 & #3 Steam Generators I n c r e a s i n g R i s k DC Cook Turbine Failure Construction Installation Procurement Design Front End Time in Months
Organizational Ability to Deal with Risk Refurbishments of 5 units in 2023; Dual Organizational risk equals Provincial risk
Organizational Ability to Deal with Risk Type of Risk Potential Rating What Experience has Shown High Moderate to High First of a Kind Decision-Making (Innovation, Cost Reduction, Efficiencies) Contractor Performance Corporate to Project Alignment (Cost vs. Asset Risk) Organizational ability to absorb many facets (Eng., Ops., Project) First-In-A-While Moderate None Lower to Moderate Lower Moderate to High Moderate to High None Moderate to High Lower Moderate
Organizational Adaptability Begin with the end in mind Dr. Stephen R. Covey The success of a refurbishment project should be measured by more than start date, end date and cost; Reaching High Levels of Performance with a sense of urgency should be part of the Goal.
Organizational Adaptability Many approaches are used to model generation (PROVIEW) Capacity Factor is a critical element in determining Net Present Value (NPV) Bold predictions are made due to its impact on the overall economic value of the project. Therefore, the organization must be able to adapt quickly from a project island to an operating island Cannot linger or be unprepared to gain the full economic advantage Defined business plan asset life time erosion
Organizational Adaptability (Candu Owners Group Paper IAEA-CN-155-005KS) Significant gains made through experience in Pickering NPP project
Organizational Adaptability In the case of Bruce Power; The main activities associated with the refurbishment of the second of the two units were completed in some cases over 60 % faster than the first These are examples of project learning s leading to significant improvements However, with a view of the End in Mind , a more holistic view of a project based on the organization s ability to adapt to a new paradigm is of interest
Organizational Adaptability Capacity Factors of Canadian Refurbished Units Calendar year of Return to Service ( IAEA 2016 data) Capacity Factor 2012 90% 1993 80% Bruce Power NPP RTS Experience Average 2 units (1500 MW) start-up year 70% 60% 2012 50% Pickering NPP RTS Experience Average 4 units (2168 MW) start-up year 750 MW 1991 40% 30% 1987 542 MW 1988 20% 750 MW 2012 542 MW 10% 542 MW 542 MW 705 MW 0% PLGS Pick #2 Pick #1 Pick #3 BA #1 Pick #4 BA #2 Excluding the start-up year, average capacity factors at Pickering NPP until Shutdown Unit #1 - 1988 to 1997; 65.5% Unit #2 - 1989 to 1997; 64.6% Unit #3 - 1992 to 1997; 67.8% Unit #4 - 1994 to 1996; 58.7% Average over 4 units (2168 MW) ~ 64%
Organizational Adaptability Capacity Factors of the latest Canadian Refurbished Units ( IAEA 2016 data) 100% 90% 80% 70% 60% Pickering NPP Experience (Average 4 units) 50% 2013-2015 Average Capacity Factors (Exclude Start-Up) 40% 30% 20% 2015 Capacity factor 10% 0% Ont. Unit #1 Ont. Unit #2 N.B. Unit
Organizational Adaptability Average Capacity Factor by Decades (New Brunswick Asset) (IAEA Data not to scale) Average 93% 100% 1983 C A P A C I T Y Does not include Refurbishment Years Average 78.5% Average 70.3% Includes start-up Year After Refurbishment F A C T O R Average 58.5% 2015 50% 00 s 10 s 80 s 90 s Time Frames in Decades
Organizational Adaptability (New Brunswick Asset) (IAEA Data not to scale) 2002 EUB decision; NB Power Proposed 89% EUB considered 80% Equivalent to new gas Generation 100% 1983 Average 93% C A P A C I T Y Does not include Refurbishment Years Average 78.5% Average 70.3% F A C T O R Achieved greater than 80% Capacity Factor 4 times in 20 years Average 58.5% Includes start-up after Year Refurbishment 2015 50% 00 s 10 s 80 s 90 s Time Frames in Decades
Organizational Adaptability (New Brunswick Asset) (IAEA Data not to scale) $2.4 Billion Investment 1983 100% Does not include Refurb Years 2008 2009 2010 2011 2012 Average 93% 1995 Watershed Event Capacity Factor Excluded From the start up of the nuclear asset in 1983 until 1994, average capacity factor of 93%. The nuclear asset achieved greater than 90 % yearly capacity nine out of twelve operating years. In 1983, operated at its lowest capacity factor in twelve operating years, 85.6% C A P A C I T Y Average 76% Average 75% From 2013 until 2015, average capacity factor of 76%. The nuclear asset exceeded 80 % yearly capacity once in three operating years. From 1996 until 2007, average capacity factor of 75%. The nuclear asset exceeded 80 % yearly capacity in three out of twelve operating years. F A C T O R 50% 00 s 10 s 80 s 90 s Time Frames in Decades
Learning from Experience Effective corporate governance for, and oversight of, project activities needs to be prevalent Understanding the risk Risk Management needs to be well defined and systematically implemented Clear understanding the assumptions Fear of impacting the Financial Investment Decision (FID) Contract Management Limited risk for the vendor Within the company; Skin in the Game Within the Project (Multi-Vendor Approach) Corporate & Project should be a team and partners Performance is primarily vendor dependent However, let there be no doubt, the risk lies with the owner!
Learning from Experience Organizational Adaptability Preparing the organization for the end of the project As critical as preparing for the start Transitional activities from project island to operating island are critical for effective Return on Investment Most importantly, prepare for the various speed bumps in the road Rotors in the water Rotor failure Re-tubing the re-tube Stagnation, litigation and adaptation
Decision Making Relating to Complex Mega Projects are Challenging; Assistance is available! Norman JD Sawyer President ION Nuclear Consulting LTD Contact Information njdsawyer@gmail.com 519-389-8642
CAMPUT (Canada s Energy & Utility Regulators) Regulatory Key Topics Meeting January 2017 Session #5; MEGA Projects Norman JD Sawyer President ION Nuclear Consulting LTD