Challenges and Solutions in Harbor Herons Citizen Science Surveys

Harbor Herons Citizen Science Surveys:
Harbor Herons Citizen Science Surveys:
Issues, Constraints, and Future Directions.
Issues, Constraints, and Future Directions.
Nellie Tsipoura, Kristin Munafo, Tom Smith, Kate Ruskin, Kim Mendillo,
Nellie Tsipoura, Kristin Munafo, Tom Smith, Kate Ruskin, Kim Mendillo,
New Jersey Audubon;
New Jersey Audubon;
Susan Elbin, New York City Audubon
Susan Elbin, New York City Audubon


Why do these Citizen Science surveys work?
•
Dedicated citizen scientists
•
Trainings
•
Volunteer input welcome
•
“Participatory” project
•
Online data entry
•
Carefully crafted protocols
•
Maintaining contact with
volunteers
What are the issues
•
Habitat Assessment
•
Effects of Tides
•
Distance
•
Data entry and program
administration
Habitat Issues
•
Reported percentages may change
drastically from one survey to the next.
–
In some cases, this may represent actual
habitat changes that occurred at the site. In
other cases, it may be due to variation in visual
estimates from one visit to the next.
Habitat Issues
•
Volunteers may have different approaches
for estimating habitat percentages.
–
Some volunteers have done this by deciding on
percentages during the first survey, and then
change only those percentages that really
change (e.g. mudflat vs. open water).
–
Other volunteers estimate percentages
independently during every survey.
Habitat Issues
Possible solutions:
•
Use only the dominant habitat class for
analysis.
Habitat – NJ and NY Data
Habitat – NJ and NY Data
•
Average total counts per point visit, for each
dominant habitat type (as selected by volunteer)
Habitat Issues
•
There are discrepancies within the same
survey, between the overall site habitat
percentages recorded and the individual
bird habitat entered under the behavioral
observations.
Habitat – Preliminary Data
Habitat – Preliminary Data
•
Specific habitats used by birds volunteers selected
for behavioral observations
Habitat – What does it mean?
Habitat – What does it mean?
•
Bird distribution may be related to dominant
habitat type even if when they selectively use a
different habitat type within the site
–
Mudflat/open water changes with tide
•
Volunteers are selecting birds in a biased way for
their behavioral observations.
–
Volunteers may be selecting open water habitat
preferentially over other habitats
•
Sampling bias?
–
More data from open water sites
More information is needed!
Habitat Issues
Possible solutions:
•
Explore habitat characteristics of sites
where no birds were seen?
•
Dominant Habitat for Points with no birds
Dominant Habitat for Points with no birds
observed (on any survey)
observed (on any survey)
Habitat – NY and NJ Data
Habitat – NY and NJ Data
•
Dominant habitat for points with no birds
Dominant habitat for points with no birds
observed was open water
observed was open water
•
N
N
ot different from the predominant habitat for
ot different from the predominant habitat for
the individual bird observations.
the individual bird observations.
However,
However,
•
I
I
s open water without associated mudflat a
s open water without associated mudflat a
reflection of hardened shorelines and water levels
reflection of hardened shorelines and water levels
that may be too deep for egrets?
that may be too deep for egrets?
Habitat – NY and NJ Data
Habitat – NY and NJ Data
More information is needed!
Habitat Issues
Possible solutions:
•
Can we analyze a subset of the data to look
at habitat use patterns?
•
Water depth
Water depth
for Great Egrets and Snowy Egrets
for Great Egrets and Snowy Egrets
Habitat – NJ Data
Habitat – NJ Data
•
Water depth
Water depth
for Great Egrets and Snowy Egrets
for Great Egrets and Snowy Egrets
Habitat – NY Data
Habitat – NY Data
Habitat Issues
Can we make management recommendations
for specific habitats based on these data?
??? Maybe not
We can analyze a subset of the data to look at
habitat use patterns.
More complex data becomes more difficult to
interpret.
Habitat Issues
Solutions:
Solutions:
•
Standardize collection of habitat information
Standardize collection of habitat information
–
estimate percentages at the beginning of the
estimate percentages at the beginning of the
season and then change only the ones that
season and then change only the ones that
vary, while keeping the others constant.
vary, while keeping the others constant.
•
Give volunteers aerial photos to ground truth
Give volunteers aerial photos to ground truth
–
Problematic.
Problematic.
•
Use staff to record habitat and other relevant site
Use staff to record habitat and other relevant site
information
information
–
Funding constraints
Funding constraints
Tide Issues
•
Tide information is crucial; however, the
Tide information is crucial; however, the
data collection and entry can be confusing.
data collection and entry can be confusing.
•
Many sites (in both the Meadowlands and
Many sites (in both the Meadowlands and
Raritan) have a tide delay, relative to the
Raritan) have a tide delay, relative to the
available tide tables.
available tide tables.
–
Some volunteers have adjusted tides using the
Some volunteers have adjusted tides using the
appropriate delay, while others do not.
appropriate delay, while others do not.
Therefore, tide information needs to be proofed
Therefore, tide information needs to be proofed
and adjusted before data analysis.
and adjusted before data analysis.
Tide Issues
•
Management changes at some sites can cause
unexpected tide fluctuations
–
Sites controlled by tide gates, sites subject to restoration
that alters tidal regimes
•
At some sites it may not be tidal cycle, but the
proportion of mudflat and open water that
determines use by waterbirds.
–
This may also relate to rainfall, site management and
lunar cycles.
Tide Issues
Possible solutions:
Possible solutions:
•
Collect tide information carefully
Collect tide information carefully
–
In 2010 we used time of survey and the time of the low
In 2010 we used time of survey and the time of the low
to and calculated the stage in the tidal cycle.
to and calculated the stage in the tidal cycle.
•
Proof tide information carefully
Proof tide information carefully
–
Incorporate the time needed to enter and correct tidal
Incorporate the time needed to enter and correct tidal
information before the data can be analyzed in project
information before the data can be analyzed in project
budgets.
budgets.
Tide – Preliminary Data
Tide – Preliminary Data
•
A subset of sites were selected for analysis
•
Focus on sites that we know have no tidal delay, or
for which delay corrections were made.
Tide – Preliminary Data
Tide – Preliminary Data
Chi-Square = 7.96; P = 0.04
Tide – Preliminary Data
Tide – Preliminary Data
Chi-Square = 38.1; P < 0.001
Tide – What does it mean?
Tide – What does it mean?
•
There is a slight effect of tide for GREGs, with
There is a slight effect of tide for GREGs, with
lower numbers at low relative to all other tides.
lower numbers at low relative to all other tides.
•
There is a large effect of tide for SNEGs, with
There is a large effect of tide for SNEGs, with
preferences for low and incoming over high and
preferences for low and incoming over high and
outgoing.
outgoing.
•
This is in agreement to the results of the
This is in agreement to the results of the
habitat/water depth data for SNEGs.
habitat/water depth data for SNEGs.
•
Our Citizen Science data are reasonably good or
Our Citizen Science data are reasonably good or
can be edited and corrected to give us the
can be edited and corrected to give us the
information we need.
information we need.
•
Distance Issues
•
There are no distance categories for the bird
observations.
•
It would be useful to know which birds are seen
relatively close to the point and which are seen at a
great distance (e.g. 500m or more).
–
This might eliminate biases in the habitat data
–
Distance categories may also allow us to undertake
some type of detection probability analysis
Distance Issues
Possible solutions:
•
Have volunteers record birds in distance classes
(less than 100m, 100-500m, >500m).
–
There may be problems related to distance estimation
in the field.
•
Have volunteers record bird locations on a site
map during every survey. This would allow us to
identify which portions/habitat within the site the
birds are using.
–
However this would result in very time intensive data
entry and proofing post-data collection.
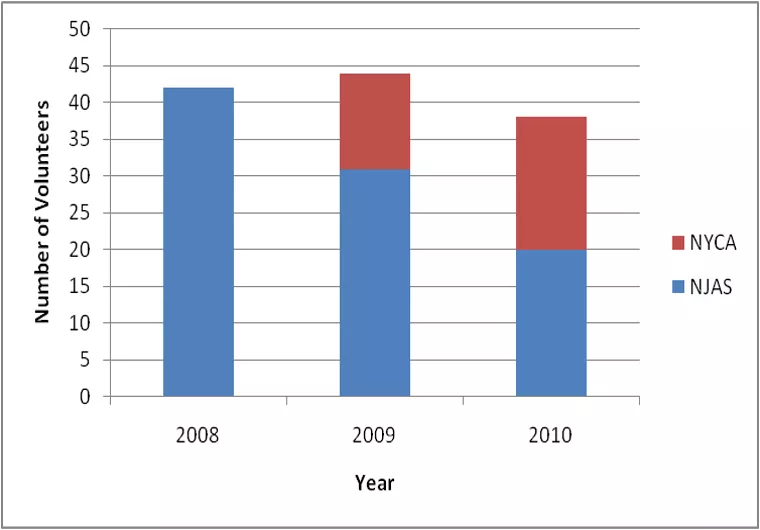
Program Administration Issues
•
Decline in volunteer participation without a staff
coordinator.
•
Data are useful, but a certain amount of post-
data collection data proofing and manipulation is
essential before any meaningful analysis.
•
Unpredictable site changes (e.g. habitat, tide)
need to be tracked through communication with
site managers.
Conclusions
Where do we go from here?
•
Citizen Science data can be used in at least some
types of analyses after being corrected and
processed
•
Continue volunteer effort – this allows us to
survey many more sites and much more often
that we would be able to do with staff.
•
Develop and obtain funding for a hybrid
volunteer/staff program to address specific
concerns such as habitat use.
The Citizen Science Surveys regarding harbor herons face various challenges such as habitat assessments, effects of tides, distance issues, and discrepancies in data entry. Volunteer input, carefully crafted protocols, and maintaining contact with volunteers help in addressing these challenges. Solutions include using dominant habitat class for analysis and addressing discrepancies in habitat percentages recorded. The surveys rely on dedicated citizen scientists and participatory approaches for accurate data collection.

Download Presentation

Please find below an Image/Link to download the presentation.
The content on the website is provided AS IS for your information and personal use only. It may not be sold, licensed, or shared on other websites without obtaining consent from the author. Download presentation by click this link. If you encounter any issues during the download, it is possible that the publisher has removed the file from their server.
E N D
Presentation Transcript
Harbor Herons Citizen Science Surveys: Issues, Constraints, and Future Directions. Nellie Tsipoura, Kristin Munafo, Tom Smith, Kate Ruskin, Kim Mendillo, New Jersey Audubon; Susan Elbin, New York City Audubon
Why do these Citizen Science surveys work? Dedicated citizen scientists Trainings Volunteer input welcome Participatory project Online data entry Carefully crafted protocols Maintaining contact with volunteers
What are the issues Habitat Assessment Effects of Tides Distance Data entry and program administration
Habitat Issues Reported percentages may change drastically from one survey to the next. In some cases, this may represent actual habitat changes that occurred at the site. In other cases, it may be due to variation in visual estimates from one visit to the next.
Habitat Issues Volunteers may have different approaches for estimating habitat percentages. Some volunteers have done this by deciding on percentages during the first survey, and then change only those percentages that really change (e.g. mudflat vs. open water). Other volunteers estimate percentages independently during every survey.
Habitat Issues Possible solutions: Use only the dominant habitat class for analysis.
Habitat NJ and NY Data Average total counts per point visit, for each dominant habitat type (as selected by volunteer) 3.5 Average # of Birds per Point Visit 3 2.5 2 1.5 1 0.5 0
Habitat Issues There are discrepancies within the same survey, between the overall site habitat percentages recorded and the individual bird habitat entered under the behavioral observations.
Habitat Preliminary Data Specific habitats used by birds volunteers selected for behavioral observations 700 Total # of Behavioral Observations 600 500 400 300 200 100 0
Habitat What does it mean? Bird distribution may be related to dominant habitat type even if when they selectively use a different habitat type within the site Mudflat/open water changes with tide Volunteers are selecting birds in a biased way for their behavioral observations. Volunteers may be selecting open water habitat preferentially over other habitats Sampling bias? More data from open water sites More information is needed!
Habitat Issues Possible solutions: Explore habitat characteristics of sites where no birds were seen?
Habitat NY and NJ Data Dominant Habitat for Points with no birds observed (on any survey) 30 25 Number of Points 20 15 10 5 0
Habitat NY and NJ Data Dominant habitat for points with no birds observed was open water Not different from the predominant habitat for the individual bird observations. However, Is open water without associated mudflat a reflection of hardened shorelines and water levels that may be too deep for egrets? More information is needed!
Habitat Issues Possible solutions: Can we analyze a subset of the data to look at habitat use patterns?
Habitat NJ Data Water depth for Great Egrets and Snowy Egrets 160 OW OWA OWB 140 Total # of Behavioral Observations 120 100 80 60 40 20 0 GREG SNEG
Habitat NY Data Water depth for Great Egrets and Snowy Egrets 60 OW OWA OWB 50 Total # of Behavioral Observations 40 30 20 10 0 GREG SNEG
Habitat Issues Can we make management recommendations for specific habitats based on these data? ??? Maybe not We can analyze a subset of the data to look at habitat use patterns. More complex data becomes more difficult to interpret.
Habitat Issues Solutions: Standardize collection of habitat information estimate percentages at the beginning of the season and then change only the ones that vary, while keeping the others constant. Give volunteers aerial photos to ground truth Problematic. Use staff to record habitat and other relevant site information Funding constraints
Tide Issues Tide information is crucial; however, the data collection and entry can be confusing. Many sites (in both the Meadowlands and Raritan) have a tide delay, relative to the available tide tables. Some volunteers have adjusted tides using the appropriate delay, while others do not. Therefore, tide information needs to be proofed and adjusted before data analysis.
Tide Issues Management changes at some sites can cause unexpected tide fluctuations Sites controlled by tide gates, sites subject to restoration that alters tidal regimes At some sites it may not be tidal cycle, but the proportion of mudflat and open water that determines use by waterbirds. This may also relate to rainfall, site management and lunar cycles.
Tide Issues Possible solutions: Collect tide information carefully In 2010 we used time of survey and the time of the low to and calculated the stage in the tidal cycle. Proof tide information carefully Incorporate the time needed to enter and correct tidal information before the data can be analyzed in project budgets.
Tide Preliminary Data A subset of sites were selected for analysis Focus on sites that we know have no tidal delay, or for which delay corrections were made. Meadowlands Mill Creek Marsh Resources Secaucus HS Marsh Raritan Center Raritan Sandy Hook Edmund s Avenue
Tide Preliminary Data Expected/Observed number of GREGs 1.2 1.15 1.1 1.05 1 Low Mid-incoming High Mid-outgoing 0.95 0.9 0.85 0.8 Chi-Square = 7.96; P = 0.04
Tide Preliminary Data Expected/Observed number of SNEGs 1.2 1.15 1.1 1.05 1 Low Mid-incoming High Mid-outgoing 0.95 0.9 0.85 0.8 Chi-Square = 38.1; P < 0.001
Tide What does it mean? There is a slight effect of tide for GREGs, with lower numbers at low relative to all other tides. There is a large effect of tide for SNEGs, with preferences for low and incoming over high and outgoing. This is in agreement to the results of the habitat/water depth data for SNEGs. Our Citizen Science data are reasonably good or can be edited and corrected to give us the information we need.
Distance Issues There are no distance categories for the bird observations. It would be useful to know which birds are seen relatively close to the point and which are seen at a great distance (e.g. 500m or more). This might eliminate biases in the habitat data Distance categories may also allow us to undertake some type of detection probability analysis
Distance Issues Possible solutions: Have volunteers record birds in distance classes (less than 100m, 100-500m, >500m). There may be problems related to distance estimation in the field. Have volunteers record bird locations on a site map during every survey. This would allow us to identify which portions/habitat within the site the birds are using. However this would result in very time intensive data entry and proofing post-data collection.
Program Administration Issues Decline in volunteer participation without a staff coordinator. Data are useful, but a certain amount of post- data collection data proofing and manipulation is essential before any meaningful analysis. Unpredictable site changes (e.g. habitat, tide) need to be tracked through communication with site managers.
Conclusions Where do we go from here? Citizen Science data can be used in at least some types of analyses after being corrected and processed Continue volunteer effort this allows us to survey many more sites and much more often that we would be able to do with staff. Develop and obtain funding for a hybrid volunteer/staff program to address specific concerns such as habitat use.