Challenges and Opportunities in the Household Appliance Industry
Total sales for household appliance stores saw a minor increase in 2018 after a recent decline, with mixed results in shipments. Industry analysts are puzzled by the flat performance in 2018, despite favorable economic conditions. The housing market's impact on appliance sales, along with factors like tariff pressure and inventory management, continue to influence the industry's trajectory. Brands and retailers are focusing on customer satisfaction, with LG leading in the ratings. Recent trends suggest a shifting landscape for major players in the industry.
Download Presentation

Please find below an Image/Link to download the presentation.
The content on the website is provided AS IS for your information and personal use only. It may not be sold, licensed, or shared on other websites without obtaining consent from the author. Download presentation by click this link. If you encounter any issues during the download, it is possible that the publisher has removed the file from their server.
E N D
Presentation Transcript
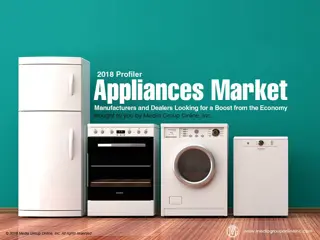
Weak Sales and Shipments Are Bad Signs Total 2018 sales for household appliance stores (NAICS 443141) increased 2.6% to $16.94 billion, following an almost 10% decrease from 2016 to 2017, and Q4 2018 was even better, with a 3.1% increase over Q4 2017. Despite a much better 2018 performance, the Association of Home Appliance Manufacturers reported total 2018 shipments of 79.18 million units, essentially unchanged from 2017. Reducing inventory may have been a factor. 2019 didn t start well for the industry, with January wholesale shipments for the six core products washers, dryers, dishwashers, refrigerators, freezers and ovens decreasing 6.5%. Increases in smaller categories, microwaves and dehumidifiers, helped somewhat.
In Search of Answers Many industry analysts are puzzled by 2018 s flat performance, given the generally good economic conditions, although prices did increase, primarily because of the application of significant tariffs. A slower housing market during the first half of 2019 also contributed to less appliance sales and, although the housing market has improved, some analysts are forecasting a 1 2% decrease in appliance shipments for all of 2019. Despite the potentially negative effects of price increases (from tariff pressure) and a volatile housing market, one analyst said they should not have had such an impact on the industry during 2018 and into 2019.
Looking for a Kickstart from Housing and Remodeling After a slow start to 2019, the US housing market has improved. Although home prices increased 3.2% during August 2019, they didn t increase as much, only 1.5%, in the 10 major cities, creating a more affordable market coupled with lower mortgage rates. September new-home and existing-home sales decreased, but the National Association of Realtors reported more positive data for pending home sales, increasing 1.5%, and the US Commerce Department stated Q3 2019 home ownership increased to 64.8%. Metrostudy reported a 3.4% YOY increase for major remodeling projects during Q2 2019, and forecasts an increase of 3.2% for all of 2019; however, 2020 activity will only increase 2.0%, and 2021, +2.4%.
Brands and Retailers Still Shine for Consumers The American Customer Satisfaction Index (ACSI) Household Appliance and Electronics Report 2018- 2019 states a slight increase in the industry score to 81 from last year s 80. LG had the highest score, or 82, but all other brands were within 2 points. Bosch suffered the most in the ASCI report, losing 3 points and relinquishing its #1 position from last year s report. Although Bosch dishwasher customers were quite satisfied with that product, its ovens and ranges scored lower as well as its mobile app. Since Millennials and other young adults are the major purchasers of appliances, it s not surprising the ACSI report found customers rated appliance mobile apps the highest, with a score of 83, and their Websites improved 4 percentage points to 81.
LG and Samsung Are #1 Choices Once again, LG was the major winner in the J.D. Power 2019 Kitchen Appliance Satisfaction StudySM, ranking first in side-by-side refrigerators, French-door refrigerators, top-mount freezer refrigerators and dishwashers. Samsung outscored all other brands in the three categories of the J.D. 2019 Laundry Appliance Satisfaction StudySM: front-load washers, top-load washers and clothes dryers, replacing LG in top- load washers and Kenmore Elite in dryers. Both studies also revealed consumers are increasingly focused on the design of appliances, not just performance and reliability, as more consumers want appliances that reflect their personal tastes and home interior designs.
Advertising Strategies As more Baby Boomers expect to remain in their homes and age in place, a combination of TV and direct mail becomes an excellent advertising strategy to reach this audience to promote the upgrading of old appliances. With a forecasted remodeling contraction, appliance retailers may find it advantageous to partner with one or more remodelers to share ad costs and/or offer a discounted combo price when consumers hire the remodeler and purchase appliances from the store. Cabinet retailers is another potential marketing partner. Invite one to provide a small, in-store display and an associate to promote built-in specialty storage, such as a wine bar or pet feeding station, with discounted prices when purchased with a new appliance.
New Media Strategies Since Millennials with new families and homes are the major target audience for appliance sales, it s important for retailers to demonstrate their support of the community with a trade-in program to refurbish appliances for low-income families, homeless shelters, etc. Pinterest may be a valuable social media platform for appliance stores to appeal to women in general and Millennial women, specifically. Create content, with the help of a remodeler partner, to show how popular appliance finishes enhance the overall look of a new kitchen. Retailers can piggyback on the J.D. Power satisfaction ratings in the Profiler by initiating a quarterly and similar survey on social media among customers who have bought those brands and asking them to rate them on a 1,000-point scale.


