Centrality Measures in Peer-to-Peer and Social Networks
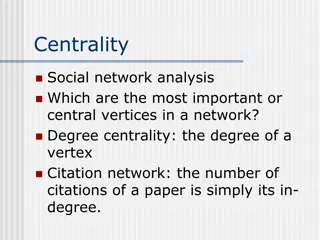
Centrality measures in networks quantify the importance of nodes based on their influence, accessibility, and role as connectors. Important centrality measures include Degree centrality (based on the number of connections), Closeness centrality (based on short paths to other nodes), and Betweenness centrality (based on being in the shortest paths between nodes). Each measure provides valuable insights into the structure and dynamics of social networks.

Download Presentation

Please find below an Image/Link to download the presentation.
The content on the website is provided AS IS for your information and personal use only. It may not be sold, licensed, or shared on other websites without obtaining consent from the author.If you encounter any issues during the download, it is possible that the publisher has removed the file from their server.
You are allowed to download the files provided on this website for personal or commercial use, subject to the condition that they are used lawfully. All files are the property of their respective owners.
The content on the website is provided AS IS for your information and personal use only. It may not be sold, licensed, or shared on other websites without obtaining consent from the author.
E N D
Presentation Transcript
Peer-to-Peer and Social Networks Centrality measures
Centrality measures Centrality is related to the potential importance of a node. Some nodes have greater influence over others compared to the rest, or are more easily accessible to other, or act as a go-between in most node-to-node communications. These are represented by various centrality measures. Some important ones are Degree centrality Closeness centrality Betweenness centrality
Degree centrality The more neighbors a given node has, the greater is its influence. In human society, a person with a large number of friends is believed to be in a favorable position compared to persons with fewer. This leads to the idea of degree centrality, which refers to the degree of a given node in the graph representing a social network.
Closeness centrality Nodes that are able to reach other nodes via shorter paths, or who are more reachable by other nodes via shorter paths, are in more favored positions. This structural advantage can be translated into power, and it leads to the notion of closeness centrality.
Closeness centrality normalized 6 4/6 4 1 6 4/6 5 4/5 5 4/5 i j d(i, j) Let denote the set of nodes, and represent the distance between and . V i j V d(i, j) A yardstick of the closeness of a node from the other nodes is . 1 j V d(i, j) This number is normalized in various ways: one is . However, a problem (n-1) occurs when the graph is partitioned, so an alternative is to consider the inverse of it n-1 d(i, j) j V i.e. as shown above.
Betweenness centrality For each pair of nodes in a social network, consider one of the shortest paths - all nodes in this path are intermediaries. The node that belongs to the shortest paths between the maximum number of such communications, is a special node it is a potential deal maker and is in a special position since most other nodes have to channel their communications through it. Such a node has a high betweenness centrality.
Computing betweenness centrality From each source node u to each destination node v, push 1 unit of flow via shortest paths. If there are multiple shortest paths, then the flow will be evenly split. The amount of flow handled by a node or an edge is a measure of its betweenness centrality.
Computing betweenness centrality Betweenness centrality of C with respect to (A, G) If each node sends 1 unit of flow to every other node (excluding C), then C will handle only 2. (1 + + ) = 4 units of flow. Why?
Random Walk Betweenness Centrality Proposed by Newman, the random walk betweenness is centrality is based on random walks, counting how often a given node is traversed by a random walk between two other nodes. This is in contrast with the deterministic approach in The previous slide that is based on shortest paths. Unlike the shortest path based centrality, random walk based centrality does not require the knowledge of the topology of the network.
Community detection A co-authorship network of physicists and mathematicians (Courtesy: Easley & Kleinberg)
What is a community? Informally a community is a tightly-knit region of the network. How to identify such a region, and how to separate them from a different tightly-knit region? It depends on how we quantify the notion of tightly-knit. Visual check of the graph is not enough, and can sometimes be misleading. Also, such regions can be nested.
What is a community? Formally, given a network with n nodes and m edges, a community detection algorithm finds subgroups of nodes C1, C2, , Cp (communities) that satisfy the following two constraints: Ci Cj = for i j, and iCi = set of all nodes in the network. Overlapping communities are not impossible, but are generally not addressed by the community detection algorithms.
What is a community? Removal of a bridge separates the graph into disjoint components bridge An example of a nested structure of the communities (Courtesy: Easley & Kleinberg)
What is a community? A-B is not a bridge, but a local bridge A, B have no common friends (Courtesy: Easley & Kleinberg)
What is a community? Is there a bridge here? A dispute caused the club to split into two clubs. How can you identify them? (Courtesy: Easley & Kleinberg)
Community detection Girvan-Newman Method Remove the edges of highest betweenness first. Repeat the same step with the remainder graph. Continue this until the graph breaks down into individual nodes. As the graph breaks down into pieces, the tightly knit community structure is exposed.
Girvan Newman method: An example Betweenness(7-8)= 7x7 = 49 Betweenness(1-3) = 1X12=12 Betweenness(3-7)=betweenness(6-7)=betweenness(8-9) = betweenness(8-12)= 3X11=33
Girvan Newman method: An example Betweenness(1-3) = 1X5=5 Betweenness(3-7)=betweenness(6-7)=betweenness(8-9) = betweenness(8-12)= 3X4=12
Girvan Newman method: An example Betweenness of every edge = 1
Another example 5X5=25
Another example 5X6=30 5X6=30
Revisiting Karate Club Network A set of minimum total strength whose removal will disconnect the rival leaders. Zachary followed this to identify the split.
Revisiting Karate Club Network Zachary initially assigned weight to each edge and then partitioned the graph by computing the min-cut. Successive application of this produces a dendogram A Dendogram
Revisiting Karate Club Network Girvan-Newman s community detection algorithm produced almost the exact solution, except for one node (node 9) However, it is not computationally efficient.