Caribbean Electrical Transmission Risk Analysis Web-Map Project
This project aims to analyze the risk factors associated with electrical transmission in the Caribbean region, focusing on Puerto Rico and the US Virgin Islands. By integrating data on the electrical grid, natural disasters, and asset information, the project seeks to provide insights for disaster preparedness and resilience. Advanced spatial analysis and open data sources are utilized to enhance the project's effectiveness. Various tools and resources such as GIS software and JavaScript APIs are employed to create a comprehensive web-map for visualizing and assessing risks. The project also emphasizes the importance of combining different spatial datasets to improve the efficiency of risk assessment and response strategies.
Download Presentation

Please find below an Image/Link to download the presentation.
The content on the website is provided AS IS for your information and personal use only. It may not be sold, licensed, or shared on other websites without obtaining consent from the author.If you encounter any issues during the download, it is possible that the publisher has removed the file from their server.
You are allowed to download the files provided on this website for personal or commercial use, subject to the condition that they are used lawfully. All files are the property of their respective owners.
The content on the website is provided AS IS for your information and personal use only. It may not be sold, licensed, or shared on other websites without obtaining consent from the author.
E N D
Presentation Transcript
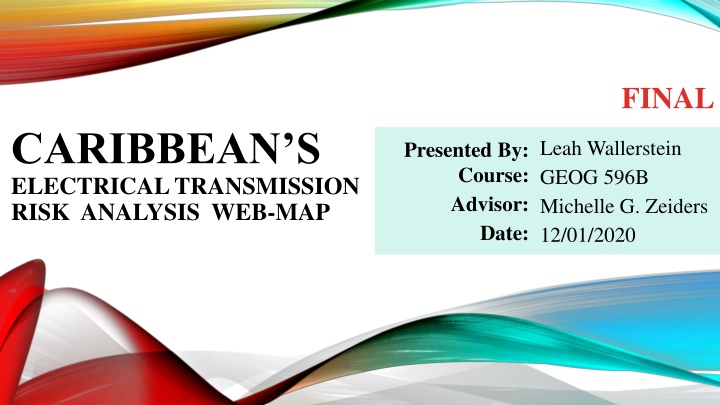
FINAL CARIBBEAN S ELECTRICAL TRANSMISSION RISK ANALYSIS WEB-MAP Leah Wallerstein GEOG 596B Michelle G. Zeiders 12/01/2020 Presented By: Course: Advisor: Date:
OUTLINE 1. Goal & Objective 2. Definition 3. How Will This Improve 4. Methodology 5. Full Demo 6. Deliverable Results 7. Acknowledgement 8. Resources 9. Questions
OUTLINE Goal & Objective GOAL & OBJECTIVE Definition How Will This Improve ? Methodology Reason for this Topic Review of the POWER LOST Report: Sizing Electricity Losses in Transmission and Distribution Systems in Latin America and the Caribbean. Current Target Site Location: Puerto Rico and US Virgin Island Reason for Site Location: High Potential of a Natural Disaster Event (Hurricanes Territory) Main Goal: Complete the initial web-map displaying the required data sources Target Site location, Electrical grid, Natural disasters, and all the important asset data information Maintain that the software and datasets are all based on an open data source Future Goal: Add advance spatial analysis (i.e. hotspots) involving the connections between the natural disaster dataset and the electrical grid Proof of Concept: Present a formal example of code with open-sourced datasets Full Demo (Web-Map Design) Deliverable Results Acknowledgement Resources Questions
OUTLINE Goal & Objective DEFINITION Definition How Will This Improve ? Methodology Electric Transmission System: An Electrical Grid Setup Powerplants, Distribution Systems, and Sub-Stations FEMA: Federal Emergency Management Agency FERC: Federal Energy Regulatory Commission OOCUR: Organization of Caribbean Utility Regulators Geany: free software is to be a lightweight stable programmer s text editor (run on windows) CodePen:A social development environment that allows the ability to write code into the browser and see its results throughout the process. Focuses on (HTML, CSS, JavaScript) QGIS:Quantum GIS; User friendly Open Source (GIS) Runs on Linux, Unix, Mac OSX, and Windows. Esri JavaScript API version 4.17:It is an application program interface that allows code that allows two software programs to communicate with each other. This focuses on the Esri Program Full Demo (Web-Map Design) Deliverable Results Acknowledgement Resources Questions
OUTLINE HOW WILL THIS IMPROVE ? Goal & Objective Definition How Will This Improve ? Methodology Current Information Process: Separate Electric Transmission Spatial Information Separate Natural Disaster Hotpot Spatial Information Limited Spatial Analysis Examples of Caribbean Islands in relations towards the Grid System Three (3) Data Elements to Analyze Connection Full Demo (Web-Map Design) Deliverable Results Acknowledgement Resources Caribbean Islands (Potential High-Risk Locations) Questions Potential Improvements of the Process: Providing a singular geospatial platform to combine the three main components Quicker Interactivity with risk assessment analysis based on the site location, natural events, and electric grid detail Electrical Transmission Grid System (Analysis of Potential Weaknesses) Natural Disaster (Measurement of the Level of Impact)
OUTLINE METHODOLOGY (1) Goal & Objective Definition How Will This Improve ? 1. Planning 1. Type of Data Needed 2. Type of Design for Optimization 3. Software Uses 1. For Data Preparation 2. For Web-Map Build Tools 3. For Web-Map Server Location 3. Web-Map Development 1. Preliminary Version: Basic Function Capability (Sample Size Data) 2. Official Version: Full Function Capability (Official Size Data) Methodology Full Demo (Web-Map Design) Deliverable Results Acknowledgement Resources 4. Testing 1. Alpha Testing (Self-Testing) 1. Review the Preliminary Version & Official Version 2. Beta Testing (Volunteer Utility Colleagues Testing) 1. Review the Official Version Questions 2. Data Collection and Organization 1. Designated Site Locations 2. Designated Analytic Data Information 5. Execute 1. Input the final version in the Designated Server
OUTLINE METHODOLOGY (2) Goal & Objective Definition How Will This Improve ? Detail Descriptions 1. Data Decision Open-Source Dataset 1. Caribbean Territory Countries (PR and VI) 2. Electric Grid Data 1. Stations 2. Transmission Wire Lines 3. Natural Disaster Data (Current and Historic) 1. Hurricane Path Data (Live Feed & Historic) 2. Earthquake Data Points (Live Monthly Feed) 3. Tornado Data Points (Historic) 4. Basemaps 1. Esri API Basemap Gallery Methodology 2. Data Source 1. Homeland Infrastructure Foundation Level Data 2. National Hurricane Center from NOAA 3. Esri ArcGIS Feature Server 3. Software Decision/Source Open Source 1. GEANY (HTML, CSS, and JS) 2. QGIS 4. Server Decision/Source Open Source 1. CodePen Full Demo (Web-Map Design) Deliverable Results Acknowledgement Resources Questions
OUTLINE FULL DEMO (WEB MAP DESIGN) Goal & Objective Definition How Will This Improve ? Methodology Web App Functions: Add Shapefile Basemap Gallery Search Print Full Demo (Web-Map Design) Deliverable Results Acknowledgement Resources Questions Data Analysis Filter Feature Table Chart CodePen Function: Export to zip (html, css, js)
OUTLINE Goal & Objective DELIVERABLE RESULTS Definition How Will This Improve ? Methodology Full Demo (Web-Map Design) Target Audience Organization of Caribbean Utility Regulators (OOCUR) FEMA of the US Homeland Security Red Cross or other Emergency Response Organizations General Utility Companies Potential Map Programmer Output Delivery Deliverable Results Acknowledgement Official Development of an Interactive Web- Map Connected to an Open-Source Server Link to the CodePen: https://codepen.io/lmw5936/pen/gOrzGqO Resources Questions Pilot Version Two (2) Completed Site Areas Output Benefits Provides a Quicker Comparison towards Status of Caribbean Territory s Electrical Grid Durability towards Natural Disasters Provides a formal example of how a web map application can be implemented with an open dataset.
OUTLINE Goal & Objective ACKNOWLEDGEMENT Definition How Will This Improve ? Methodology Full Demo (Web-Map Design) Thank You Deliverable Results Wish to take this time to say thank you to my advisor, Michelle Zeiders. I truly appreciate the guidance that assist with proving methodology towards the capstone project. The valuable critique and professional advice during the development process were insightful during the development of this presentation and help in making this project promising. Acknowledgement Resources Questions Michelle G. Zeiders Assistant Teaching Professor, GIS Program Dutton e-Education Institute/ Department of Geography College of Earth and Mineral Science The Pennsylvania State University
OUTLINE Goal & Objective RESOURCES Definition How Will This Improve ? Methodology Main Sources Jimenez, Raul & Serebrisky, Tomas & Mercado, Jorge. (2014). POWER LOST: Sizing Electricity Losses in Transmission and Distribution Systems in Latin America and the Caribbean. 10.13140/2.1.4493.1529. Definition Sources Environmental Systems Research Institute, Inc. (2016). What is a shapefile? Retrieved from desktop.arcgis.com: https://desktop.arcgis.com/en/arcmap/10.3/manage-data/shapefiles/what-is-a- shapefile.htm Esri. (2020). ArcGIS API for JavaScript. Retrieved from developers.arccgis.com: https://developers.arcgis.com/javascript/ FERC. (2019, August 30). About FERC. Retrieved from www.ferc.gov: https://www.ferc.gov/about/about.asp Geany. (2020). Geany - The Flyweight IDE. Retrieved from www.geany.org: https://www.geany.org/ Organization Of Caribbean Utility Regulator. (2020). Organization Of Caribbean Utility Regulator. Retrieved from oocur.org: https://oocur.org/ Synopsys, Inc. (2020). QGIS. Retrieved from www.openhub.net: https://www.openhub.net/p/qgis StackShare, Inc. (2020). CodePen vs. Github. Retrieved from stackshare.io: https://stackshare.io/stackups/codepen-vs-github Wallechinski, D. (2016). Federal Emergency Management Agency (FEMA). Retrieved from www.allgov.com: http://www.allgov.com/departments/department-of-homeland-security/federal-emergency- management-agency-fema?agencyid=7345 Full Demo (Web-Map Design) Deliverable Results Acknowledgement Resources Questions
OUTLINE QUESTIONS Goal & Objective Definition How Will This Improve ? Methodology Full Demo (Web-Map Design) Deliverable Results Acknowledgement Resources Questions
