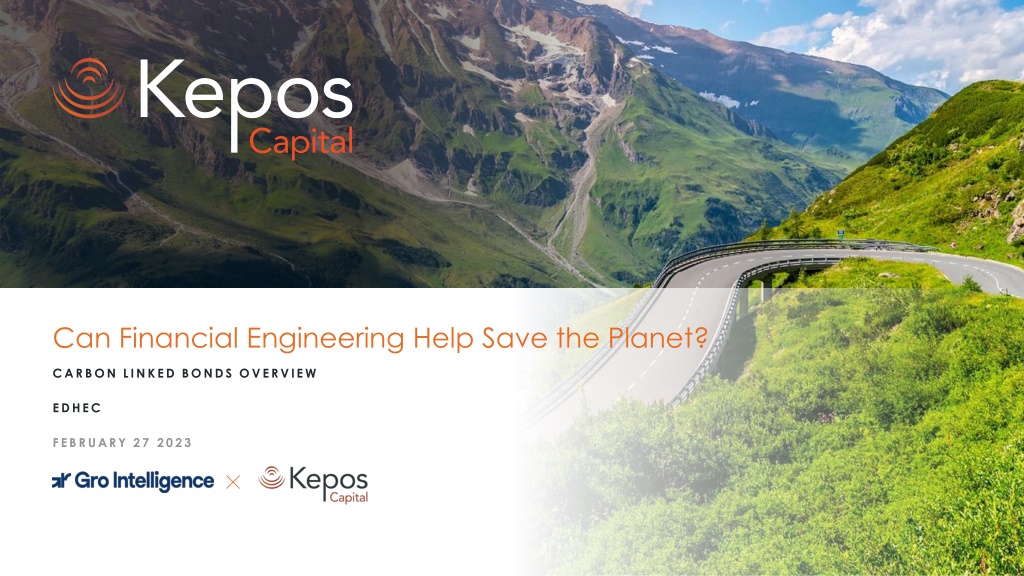
Can Financial Engineering Help Save the Planet?
Explore the potential of financial engineering in combating climate change through carbon-linked bonds. Dive into the concept of scaling low carbon investments, optimizing portfolio allocations, and creating credibility using financial tools. Discover how the Carbon Barometer aggregates data to track country-specific policies and carbon pricing initiatives to drive sustainable practices.
Download Presentation

Please find below an Image/Link to download the presentation.
The content on the website is provided AS IS for your information and personal use only. It may not be sold, licensed, or shared on other websites without obtaining consent from the author.If you encounter any issues during the download, it is possible that the publisher has removed the file from their server.
You are allowed to download the files provided on this website for personal or commercial use, subject to the condition that they are used lawfully. All files are the property of their respective owners.
The content on the website is provided AS IS for your information and personal use only. It may not be sold, licensed, or shared on other websites without obtaining consent from the author.
E N D
Presentation Transcript
Can Financial Engineering Help Save the Planet? CARBON LINKED BONDS OVERVIEW EDHEC FEBRUARY 27 2023
DISCLAIMER Disclaimer This document constitutes research and sole opinion of the presenter and does not constitute an offer to sell or a solicitation of an offer to purchase any security. This document is confidential, is intended only for the person to whom it has been provided and under no circumstance may a copy be shown, copied, transmitted, or otherwise given to any person other than the authorized recipient without the prior written consent of Kepos Capital LP. Environmental and climate science is an evolving discipline. Kepos does not purport to independently verify any scientific facts or opinions related to such. Statements related to environmental and climate science presented herein are based purely on our review of third party sources and represents our beliefs. 2
ORDERS OF MAGNITUDE Three Orders of Magnitude Misquote Billions versus Trillions Taxpayers are subsidizing fossil fuels more than ever Countries around the world paid a staggering $1.3 billion to make fossil fuels more affordable in 2022, almost triple the bill from two years earlier, according to a report released today by the International Monetary Fund The I.M.F. report calculated a much higher subsidy total of $7 billion when indirect costs were included especially the amount that governments should charge to account for global warming and local air pollution. Manuela Andreoni A correction was made on August 24, 2023: An earlier version of this article misstated the value of fossil fuel subsidies. It is $1.3 trillion, not $1.3 billion. Source: Steel Is Getting Cleaner. New York Times, August 24, 2023. https://www.nytimes.com/2023/08/24/climate/steel-is-getting-cleaner.html#:~:text=Electric%20arc%20furnaces%2C%20which%20use,study%20by%20Global%20Energy%20Monitor. 3
ORDERS OF MAGNITUDE From $1.5 Trillion to around $4 Trillion Can We Scale Low Carbon Investments 3 Times? Focus on policy expectations Optimized portfolio allocations today are very sensitive to expected future returns Use financial engineering to create credibility Consider TIPS Treasury Inflation Protected Securities Start by defining a carbon price Incentives come in many forms 4
CARBON BAROMETER OVERVIEW DATA AGGREGATION Computation of the Carbon Barometer Country-specific Policy Documents Policy-specific Carbon Pricing Country-level time series of carbon pricing Policy Databases Reactive to underlying changes in current policies, or new policies under similar themes Standardized by contribution to total carbon emissions Energy Use & Economic Data Emissions & Sector Contribution Consistent data ingestion and normalization Emissions Inventory Databases 5
POLICY OVERVIEW DATA AGGREGATION Overview of Seven Main Policies Policy Direction Description Carbon Tax Tariff Carbon taxes are an explicit form of carbon pricing that impose a fixed fee on every ton of CO2 emission from regulated entities. Emissions Trading System (ETS) Tariff ETS are an explicit form of carbon pricing that cap the overall carbon emissions from regulated polluters & issue tradable allowances. When allowances are auctioned, allowance price provides marginal incentive to reduce CO2 emissions. Fossil Fuel Tax Tariff Governments impose taxes on transportation fuel at the pump, which provides a marginal incentive to reduce transportation carbon emissions. Covers taxes levied on energy use from fossil fuels for transportation, industry, agriculture, residential and commercial units, and utilities. Fossil Fuel Subsidy Subsidy Fossil fuel subsidies are effectively negative carbon prices. They are expenditures by the government that support fossil fuels and are still ubiquitous around the world, especially in developing countries. Feed-in Tariffs Tariff FITs offer a price premium for renewable energy provided to the grid. This price premium is set by the government and paid to renewable energy producers by consumers. The price premium is typically an absolute amount, denoted in dollars per MWh. Renewable Portfolio Standards Tariff RPS require electricity providers to supply a certain percentage of their electricity with renewable sources. Tradable renewable energy credits (RECs) can be purchased by suppliers who fail to achieve this percentage requirement. Low-Carbon Fuel Standards Tariff LCFS impose a limit on carbon intensity for fuels. Suppliers below the rate receive credits denoted in metric tons of carbon dioxide. Suppliers above the rate incur deficits to rectify either through abatement or purchase of credits. 6
GLOBAL PRICE EVOLUTION Carbon Barometer Evolution of Global Carbon Price The Global Carbon Barometer price has increased steadily over the past decade, until 2022. Policy Overview, Global Carbon Barometer Price $USD/MTCO2 Total Emissions M MTCO2 Emissions Intensity of GDP kg CO2/$USD Net Carbon Charges as % of GDP Policy Evolution Country Carbon Barometer Price Total Carbon Charges Total Carbon Subsidies $31.76 $20.76 Global $4.08 28713 0.34 0.14% -$10.01 -$27.67 7 Strictly Confidential. Not for Distribution.
CARBON BAROMETER VISUALIZATION DATA AGGREGATION Carbon Barometer Visualization CBP vs. Total CO2 Emissions, 2021 -200 -100 0 100 Spain United Kingdom Netherlands $18.97 Carbon Barometer Price $USD/MTCO2 France Germany Italy Belgium Additional views Country-level policy data and evolution over time of Carbon Barometer price South Korea Canada Czech Republic Japan Poland Turkey Disaggregated seven policies and contribution to overall Carbon Barometer calculation South Africa India Global United States Australia China, mainland Carbon Barometer Price $USD/MTCO2 Total Carbon Dioxide Emissions Brazil Russia Mexico Argentina Indonesia United Arab Emirates Saudi Arabia 8 Iran
CARBON BAROMETER VISUALIZATION DATA AGGREGATION Carbon Barometer Visualization CBP vs. Total CO2 Emissions, 2022 -200 -100 0 100 Spain Germany Canada France South Korea Czech Republic $4.08 Carbon Barometer Price Down 78% from 2021 Japan Turkey South Africa Belgium China, mainland Poland United States India Brazil Australia United Kingdom Global Netherlands Argentina Indonesia Carbon Barometer Price $USD/MTCO2 Total Carbon Dioxide Emissions Italy Mexico Russia Saudi Arabia United Arab Emirates 9 Iran
CARBON BAROMETER VISUALIZATION DATA AGGREGATION Change in Carbon Barometer Price Change in CBP from 2021 to 2022 -$150.00 -$75.00 $0.00 Argentina Canada $13.80 Country Argentina Canada Brazil Indonesia China, mainland Czech Republic United States Australia Germany India South Africa South Korea Turkey Global Japan Poland Spain Mexico Belgium Saudi Arabia France United Arab Emirates Russia Iran United Kingdom Netherlands Italy 2021 Price -$22.50 $57.33 $9.06 -$27.13 $13.93 $51.80 $18.47 $16.90 $101.85 $21.93 $27.39 $68.61 $31.42 $18.97 $48.47 $48.11 $130.28 -$20.78 $72.19 -$71.61 $120.64 -$63.51 -$11.62 -$89.47 $127.94 $122.58 $100.18 2022 Price -$8.71 $66.31 $15.77 -$20.66 $18.87 $56.32 $17.85 $14.06 $96.31 $16.29 $21.20 $59.13 $21.21 $4.08 $24.76 $18.53 $96.67 -$64.88 $20.96 -$125.63 $63.71 -$126.59 -$103.57 -$189.87 $9.68 -$8.56 -$44.42 $8.98 Brazil $6.71 Indonesia $6.47 China, mainland Czech Republic United States Australia Germany $4.93 $4.52 -$0.61 -$2.84 -$5.54 India -$5.63 South Africa South Korea Turkey Global Japan Poland -$6.20 -$9.48 -$10.22 -$14.89 -$23.71 -$29.58 Spain Mexico Belgium -$33.62 -$44.10 -$51.23 Saudi Arabia France -$54.02 -$56.93 United Arab Emirates -$63.08 Russia Iran -$91.95 -$100.40 United Kingdom Netherlands -$118.26 -$131.14 Italy -$144.61 10
POLICY CONTRIBUTIONS Carbon Barometer Policy Contributions The Carbon Barometer framework allows users to clearly understand the relative contribution of various policies to a country-level Carbon Price Individual Policy Contribution to Carbon Barometer Price Country Carbon Barometer Price Fossil Fuel Subsidies Carbon Tax Emissions Carbon Barometer Price Fossil Fuel Subsidies Carbon Tax Emissions Trading Systems Trading Systems $USD/MTCO2 $USD/MTCO2 $USD/MTCO2 $USD/MTCO2 $USD/MTCO2 $USD/MTCO2 $USD/MTCO2 $USD/MTCO2 2021 2022 Global $18.97 -$11.07 $1.03 $3.09 $4.08 -$27.67 $1.12 $6.00 France $120.64 -$34.85 $26.69 $19.91 $63.71 -$110.32 $25.55 $34.61 United States $18.47 -$1.99 $0.00 $1.21 $17.85 -$2.91 $0.00 $2.03 China $13.93 -$2.38 $0.00 $0.35 $18.87 -$2.37 $0.00 $4.55 11
POTENTIAL APPLICATIONS Deriving a Product from the Carbon Barometer Carbon-Linked Bonds Reveal Forward Expectations Coupon Payment as a Function of Carbon Barometer Price in Year 10 Target Prices vs Market Expectation $180.00 6.00% $160.00 $140.00 5.00% $120.00 4.00% $100.00 Coupon $80.00 3.00% $60.00 2.00% $40.00 1.00% $20.00 $- 0.00% 2023 2028 2032 2037 2043 2047 2053 $40.00 $50.00 $60.00 $70.00 $80.00 $90.00 $100.00 $110.00 Carbon Price in Year 10 Target Price Market Expectation Coupon and principal are tied to the Carbon Price The forward curve for carbon prices 1. Forward dates have targeted carbon prices 2. A lower borrowing cost as a commitment device missing target costs the issuer 3. Weak policy increases return to investors, and 4. Carbon forward curve allows hedging, reveals expectations, and accelerates investment in low-emissions capital 12
POTENTIAL APPLICATIONS Global Harmonization of Incentives to Reduce Emissions Highlight the Path to Elimination of Carbon Subsidies Fossil Fuel Subsidies Explicit and Implicit $7 trillion $7,000 Global Fossil Fuel Subsidies $6,000 $5,000 US $ billions $4,000 $3,000 $2,000 $1,000 $0 2020 2025 Explicit Fossil Fuel Subsidies 2030 2035 2040 2045 Implicit Fossil Fuel Subsidies Charting a Path to End Fossil Fuel Subsidies 1. Fossil fuel subsidies promote inefficient allocation of an economy s resources and encourage pollution 2. Raising fuel prices to their fully efficient levels reduces projected global fossil fuel CO2 emissions by 36% below baseline levels1 3. Reducing subsidies saves money for taxpayers and redistributes investments towards sustainable and equitable outcomes 1 Source: International Monetary Fund, Fossil Fuel Subsidies 13

![[PDF⚡READ❤ONLINE] Neptune: The Planet, Rings, and Satellites](/thumb/21522/pdf-read-online-neptune-the-planet-rings-and-satellites.jpg)
![[PDF⚡READ❤ONLINE] Planet Mercury: From Pale Pink Dot to Dynamic World (Springer](/thumb/21549/pdf-read-online-planet-mercury-from-pale-pink-dot-to-dynamic-world-springer.jpg)


