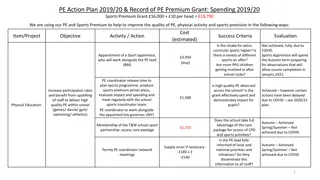
Calculating Team Efficiency in Sports


Making the future of young minds
To assess the efficiency of the team while calculating the mean, you can refer to the following
pointers:
1.
Goals Scored: What is the average number of goals scored per game? This can give an
indication of the team's attacking efficiency and scoring prowess.
2.
Goals Assisted: What is the average number of goals assisted by the team? This provides
insights into the team's ability to create scoring opportunities and the effectiveness of their
playmaking.
3.
Shots per Game: What is the average number of shots taken by the team in a game? This
indicates the team's offensive aggression and their willingness to take scoring opportunities.
4.
Aerials Won: What is the average number of aerial duels won by the team? This reflects the
team's ability to dominate in the air, both in attack and defense.
5.
Red Cards: What is the average number of red cards received by the team? This measures the
team's discipline and can indicate whether you are prone to making costly mistakes or losing
control during matches.
6.
Yellow Cards: What is the average number of yellow cards received by the team? This shows
the team's aggression and their tendency to commit fouls, which may affect their overall
efficiency on the field.
By calculating the mean for each of these parameters,we can gain insights into the team's efficiency
and performance in various aspects of the game. you can compare these averages with those of
other teams
Mean
Making the future of young minds
Mean
Making the future of young minds
Mean
1.
Based on the calculated means, _____ has an average of ___ goals
scored per game. This suggests that Team ___ has a stronger
attacking efficiency.
2.
Looking at the mean of goals assisted, Team C has an average of ___.
This indicates that Team ______ has a better playmaking ability and
creates more scoring opportunities.
3.
In terms of shots per game, Team_____ has an average of ___. This
suggests that Team_____shows more offensive aggression and takes
more scoring opportunities.
4.
Calculating the mean of aerials won, Team ___ has an average of ___.
This indicates that Team ___ is more dominant in the air, both in attack
and defense.
5.
Considering the mean of red cards, Team ___ has an average of ___.
This reveals differences in discipline, with Team ___ being more prone
to receiving red cards.
6.
Looking at the mean of yellow cards, Team ___ has an average of ___,
This shows that Team ___ is more aggressive and tends to commit
more fouls.
Based on these calculated means, it can be concluded that Team ___ has
an advantage in terms of ___, while Team ___ shows strength in ___. These
findings help us evaluate the performance of each team and make informed
judgments about their likely success.
Making the future of young minds
When calculating the mode, you can refer to the following pointers to to gauge the efficiency of the
team:
1.
Shots per Game: What is the most common or frequent number of shots taken by the team in a
game? This can indicate the team's preferred or most effective approach in terms of offensive
efficiency.
2.
Goals Scored: Which goal tally occurs most frequently? This reveals the team's consistent
scoring output and identifies their most common level of success in finding the back of the net.
3.
Goals Assisted: Which number of assists appears most often? This highlights the team's
playmaking efficiency and identifies the typical level of involvement from teammates in
creating scoring opportunities.
4.
Aerials Won: What is the most frequent number of aerial duels won by the team? This
showcases the team's dominance in the air and their ability to efficiently contest and secure
aerial challenges.
5.
Red Cards: How many red cards occur most frequently? This identifies the team's most
common level of discipline or lack thereof, which can impact their efficiency by forcing them to
play with fewer players.
6.
Yellow Cards: Which number of yellow cards is most commonly received by the team? This
indicates the team's frequency of committing fouls or engaging in aggressive play, which can
affect their overall efficiency and discipline on the field.
By determining the mode for each of these variables, we can gain insights into the team's efficiency
tendencies and identify recurring patterns or areas of strength or weakness. This information can
help inform discussions about the team's overall effectiveness.
Mode
Making the future of young minds
Mode
Making the future of young minds
Mode
1.
When analyzing the mode of goals scored, Team ____ has a mode of
___. This suggests that Team ___ is more consistent in scoring goals
compared to the other teams.
2.
Looking at the mode of goals assisted, Team ____ has a most frequent
occurrence of ___, which is higher than the rest. This indicates that
Team _____ has a stronger playmaking ability and consistently
contributes to creating scoring opportunities.
3.
In terms of shots per game, Team_____ has a mode of ___. This
reveals specific shot patterns for each team, with Team ___ being the
most frequent in taking shots.
4.
Calculating the mode of aerials won, Team ___ has a most frequent
occurrence of ___. This suggests that Team ___ excels in winning
aerial duels consistently.
5.
Considering the mode of red cards, Team ___ has a most frequent
occurrence of ___. This reveals differences in the frequency of
receiving red cards, with Team ___ being more prone to such
disciplinary issues.
6.
Looking at the mode of yellow cards, Team ___ has a mode of ___.
This shows that Team ___ tends to commit fouls more frequently
compared to the other teams.
Based on these calculated modes, it can be concluded that Team ___
demonstrates consistency in ___, while Team ___ shows strength in ___.
These findings further contribute to evaluating the performance of each team
and making informed judgments about their likely success.
Making the future of young minds
When calculating the median, you can encourage learners to ask the following questions to assess
the efficiency of the team:
1.
Height: What is the median height of the players in the team? This provides insights into the
team's physical attributes and can indicate their ability to excel in aerial challenges or
defensive capabilities.
2.
Weight: What is the median weight of the players in the team? This gives an indication of the
team's physical strength and can impact their ability to win physical battles on the field.
3.
Goals Scored: What is the median number of goals scored by the team? This represents the
middle value in the distribution of goals scored and can provide a measure of their consistent
offensive output.
4.
Goals Assisted: What is the median number of goals assisted by the team? This reflects the
team's ability to create scoring opportunities and highlights their playmaking effectiveness.
5.
Shots per Game: What is the median number of shots taken by the team in a game? This
indicates the team's typical level of offensive aggression and can reflect their efficiency in
creating scoring chances.
6.
Aerials Won: What is the median number of aerial duels won by the team? This showcases their
ability to compete and succeed in aerial battles, which can be important for both offensive and
defensive efficiency.
By determining the median for these variables, we can gain insights into the team's efficiency
tendencies and identify the typical or middle ground of their performance. Comparing these values
to the mean and considering the distribution of data can provide a more comprehensive
understanding of the team's overall efficiency and strengths.
Median
Making the future of young minds
Median
Making the future of young minds
Median
1.
When considering the median of goals scored, Team ____ has a median of
___ This suggests that Team ___ has a more typical or representative
goal-scoring performance compared to the other teams.
2.
Looking at the median of goals assisted, Team ______ has a median of
___, which is higher than the rest. This indicates that Team ____ has
players who consistently contribute to creating scoring opportunities.
3.
In terms of shots per game, Team ______ has a median of ___. This
reveals the typical number of shots taken by each team, with Team ___
having a higher median and indicating a more aggressive offensive
approach.
4.
Calculating the median of aerials won, Team ___ has a median of ___.
This suggests that Team ___ consistently performs well in winning aerial
duels.
5.
Considering the median of red cards, Team ___ has a median of ___, This
reveals differences in the frequency of receiving red cards, with Team ___
having a more typical or representative disciplinary record.
6.
Looking at the median of yellow cards, Team ___ has a median of ___.
This shows that Team ___ has a more typical or representative tendency
to commit fouls compared to the other teams.
Based on these calculated medians, it can be concluded that Team ___
showcases a typical performance in ___, while Team ___ demonstrates
strength in ___. These findings contribute to evaluating the performance of each
team and making informed judgments about their likely success.
Making the future of young minds
My Winning Team
Insert Winning Team’s Flag Image here.
Describe with data, what makes you think that Team [insert team name] is going to win
the next match. Support your answer using the central measures of tendency you
analyzed for different criteria. Consider the following points:
1.
Goals Scored: Team [insert team name] has the highest mean goals scored per
game, indicating their strong attacking efficiency and scoring prowess. They
consistently perform well in finding the back of the net.
2.
Pass Success Percentage: Team [insert team name] has the highest mean pass
success percentage, highlighting their superior passing accuracy and ability to
maintain possession. This enables them to control the game and create scoring
opportunities.
3.
Shots per Game: Team [insert team name] has the highest mode of shots per
game, indicating that they frequently take more shots compared to the other
teams. This aggressive approach increases their chances of scoring goals.
4.
Aerial Duels Won: Team [insert team name] has the highest median of aerial duels
won, demonstrating their dominance in aerial battles. This gives them an
advantage in both attacking and defending situations.
5.
Discipline: Team [insert team name] has the lowest mean and mode of red cards
received, indicating their disciplined play and ability to avoid costly mistakes. This
ensures that they can maintain composure and control throughout the match.
By analyzing these central measures of tendency, it is evident that Team [insert team
name] excels in various aspects of the game,. Their consistent performance in these
areas suggests that they are well-prepared and have a higher likelihood of winning the
next match.
Please use the data you have analyzed and provide specific numerical values and
statistical measures to support your reasoning.
Assess team performance by analyzing averages of goals scored, assists, shots taken, aerials won, red and yellow cards received. Compare these metrics to evaluate strengths and weaknesses for informed decisions.

Download Presentation

Please find below an Image/Link to download the presentation.
The content on the website is provided AS IS for your information and personal use only. It may not be sold, licensed, or shared on other websites without obtaining consent from the author.If you encounter any issues during the download, it is possible that the publisher has removed the file from their server.
You are allowed to download the files provided on this website for personal or commercial use, subject to the condition that they are used lawfully. All files are the property of their respective owners.
The content on the website is provided AS IS for your information and personal use only. It may not be sold, licensed, or shared on other websites without obtaining consent from the author.
E N D
Presentation Transcript
Making the future of young minds Mean To assess the efficiency of the team while calculating the mean, you can refer to the following pointers: 1. Goals Scored: What is the average number of goals scored per game? This can give an indication of the team's attacking efficiency and scoring prowess. Goals Assisted: What is the average number of goals assisted by the team? This provides insights into the team's ability to create scoring opportunities and the effectiveness of their playmaking. Shots per Game: What is the average number of shots taken by the team in a game? This indicates the team's offensive aggression and their willingness to take scoring opportunities. Aerials Won: What is the average number of aerial duels won by the team? This reflects the team's ability to dominate in the air, both in attack and defense. Red Cards: What is the average number of red cards received by the team? This measures the team's discipline and can indicate whether you are prone to making costly mistakes or losing control during matches. Yellow Cards: What is the average number of yellow cards received by the team? This shows the team's aggression and their tendency to commit fouls, which may affect their overall efficiency on the field. 2. 3. 4. 5. 6. By calculating the mean for each of these parameters,we can gain insights into the team's efficiency and performance in various aspects of the game. you can compare these averages with those of other teams
Making the future of young minds Mean Mean of Mean of Mean of Mean of Mean of Mean of Team Goals Goals Shots per Aerials Yellow Red Cards Scored Assisted Game Won Cards
Making the future of young minds Mean 1. Based on the calculated means, _____ has an average of ___ goals scored per game. This suggests that Team ___ has a stronger attacking efficiency. 2. Looking at the mean of goals assisted, Team C has an average of ___. This indicates that Team ______ has a better playmaking ability and creates more scoring opportunities. 3. In terms of shots per game, Team_____ has an average of ___. This suggests that Team_____shows more offensive aggression and takes more scoring opportunities. 4. Calculating the mean of aerials won, Team ___ has an average of ___. This indicates that Team ___ is more dominant in the air, both in attack and defense. 5. Considering the mean of red cards, Team ___ has an average of ___. This reveals differences in discipline, with Team ___ being more prone to receiving red cards. 6. Looking at the mean of yellow cards, Team ___ has an average of ___, This shows that Team ___ is more aggressive and tends to commit more fouls. Based on these calculated means, it can be concluded that Team ___ has an advantage in terms of ___, while Team ___ shows strength in ___. These findings help us evaluate the performance of each team and make informed judgments about their likely success.
Making the future of young minds Mode When calculating the mode, you can refer to the following pointers to to gauge the efficiency of the team: 1. Shots per Game: What is the most common or frequent number of shots taken by the team in a game? This can indicate the team's preferred or most effective approach in terms of offensive efficiency. Goals Scored: Which goal tally occurs most frequently? This reveals the team's consistent scoring output and identifies their most common level of success in finding the back of the net. Goals Assisted: Which number of assists appears most often? This highlights the team's playmaking efficiency and identifies the typical level of involvement from teammates in creating scoring opportunities. Aerials Won: What is the most frequent number of aerial duels won by the team? This showcases the team's dominance in the air and their ability to efficiently contest and secure aerial challenges. Red Cards: How many red cards occur most frequently? This identifies the team's most common level of discipline or lack thereof, which can impact their efficiency by forcing them to play with fewer players. Yellow Cards: Which number of yellow cards is most commonly received by the team? This indicates the team's frequency of committing fouls or engaging in aggressive play, which can affect their overall efficiency and discipline on the field. 2. 3. 4. 5. 6. By determining the mode for each of these variables, we can gain insights into the team's efficiency tendencies and identify recurring patterns or areas of strength or weakness. This information can help inform discussions about the team's overall effectiveness.
Making the future of young minds Mode Mode of Mode of Mode of Mode of Mode of Mode of Team Goals Goals Shots per Aerials Yellow Red Cards Scored Assisted Game Won Cards
Making the future of young minds Mode 1. When analyzing the mode of goals scored, Team ____ has a mode of ___. This suggests that Team ___ is more consistent in scoring goals compared to the other teams. 2. Looking at the mode of goals assisted, Team ____ has a most frequent occurrence of ___, which is higher than the rest. This indicates that Team _____ has a stronger playmaking ability and consistently contributes to creating scoring opportunities. 3. In terms of shots per game, Team_____ has a mode of ___. This reveals specific shot patterns for each team, with Team ___ being the most frequent in taking shots. 4. Calculating the mode of aerials won, Team ___ has a most frequent occurrence of ___. This suggests that Team ___ excels in winning aerial duels consistently. 5. Considering the mode of red cards, Team ___ has a most frequent occurrence of ___. This reveals differences in the frequency of receiving red cards, with Team ___ being more prone to such disciplinary issues. 6. Looking at the mode of yellow cards, Team ___ has a mode of ___. This shows that Team ___ tends to commit fouls more frequently compared to the other teams. Based on these calculated modes, it can be concluded that Team ___ demonstrates consistency in ___, while Team ___ shows strength in ___. These findings further contribute to evaluating the performance of each team and making informed judgments about their likely success.
Making the future of young minds Median When calculating the median, you can encourage learners to ask the following questions to assess the efficiency of the team: 1. Height: What is the median height of the players in the team? This provides insights into the team's physical attributes and can indicate their ability to excel in aerial challenges or defensive capabilities. Weight: What is the median weight of the players in the team? This gives an indication of the team's physical strength and can impact their ability to win physical battles on the field. Goals Scored: What is the median number of goals scored by the team? This represents the middle value in the distribution of goals scored and can provide a measure of their consistent offensive output. Goals Assisted: What is the median number of goals assisted by the team? This reflects the team's ability to create scoring opportunities and highlights their playmaking effectiveness. Shots per Game: What is the median number of shots taken by the team in a game? This indicates the team's typical level of offensive aggression and can reflect their efficiency in creating scoring chances. Aerials Won: What is the median number of aerial duels won by the team? This showcases their ability to compete and succeed in aerial battles, which can be important for both offensive and defensive efficiency. 2. 3. 4. 5. 6. By determining the median for these variables, we can gain insights into the team's efficiency tendencies and identify the typical or middle ground of their performance. Comparing these values to the mean and considering the distribution of data can provide a more comprehensive understanding of the team's overall efficiency and strengths.
Making the future of young minds Median Median of Median of Median of Median of Median of Median of Team Goals Goals Shots per Aerials Yellow Red Cards Scored Assisted Game Won Cards
Making the future of young minds Median 1. When considering the median of goals scored, Team ____ has a median of ___ This suggests that Team ___ has a more typical or representative goal-scoring performance compared to the other teams. 2. Looking at the median of goals assisted, Team ______ has a median of ___, which is higher than the rest. This indicates that Team ____ has players who consistently contribute to creating scoring opportunities. 3. In terms of shots per game, Team ______ has a median of ___. This reveals the typical number of shots taken by each team, with Team ___ having a higher median and indicating a more aggressive offensive approach. 4. Calculating the median of aerials won, Team ___ has a median of ___. This suggests that Team ___ consistently performs well in winning aerial duels. 5. Considering the median of red cards, Team ___ has a median of ___, This reveals differences in the frequency of receiving red cards, with Team ___ having a more typical or representative disciplinary record. 6. Looking at the median of yellow cards, Team ___ has a median of ___. This shows that Team ___ has a more typical or representative tendency to commit fouls compared to the other teams. Based on these calculated medians, it can be concluded that Team ___ showcases a typical performance in ___, while Team ___ demonstrates strength in ___. These findings contribute to evaluating the performance of each team and making informed judgments about their likely success.
Making the future of young minds My Winning Team Insert Winning Team s Flag Image here. Describe with data, what makes you think that Team [insert team name] is going to win the next match. Support your answer using the central measures of tendency you analyzed for different criteria. Consider the following points: 1. Goals Scored: Team [insert team name] has the highest mean goals scored per game, indicating their strong attacking efficiency and scoring prowess. They consistently perform well in finding the back of the net. Pass Success Percentage: Team [insert team name] has the highest mean pass success percentage, highlighting their superior passing accuracy and ability to maintain possession. This enables them to control the game and create scoring opportunities. Shots per Game: Team [insert team name] has the highest mode of shots per game, indicating that they frequently take more shots compared to the other teams. This aggressive approach increases their chances of scoring goals. Aerial Duels Won: Team [insert team name] has the highest median of aerial duels won, demonstrating their dominance in aerial battles. This gives them an advantage in both attacking and defending situations. Discipline: Team [insert team name] has the lowest mean and mode of red cards received, indicating their disciplined play and ability to avoid costly mistakes. This ensures that they can maintain composure and control throughout the match. 2. 3. 4. 5. By analyzing these central measures of tendency, it is evident that Team [insert team name] excels in various aspects of the game,. Their consistent performance in these areas suggests that they are well-prepared and have a higher likelihood of winning the next match. Please use the data you have analyzed and provide specific numerical values and statistical measures to support your reasoning.