Block Graphs: Examples and Explanations

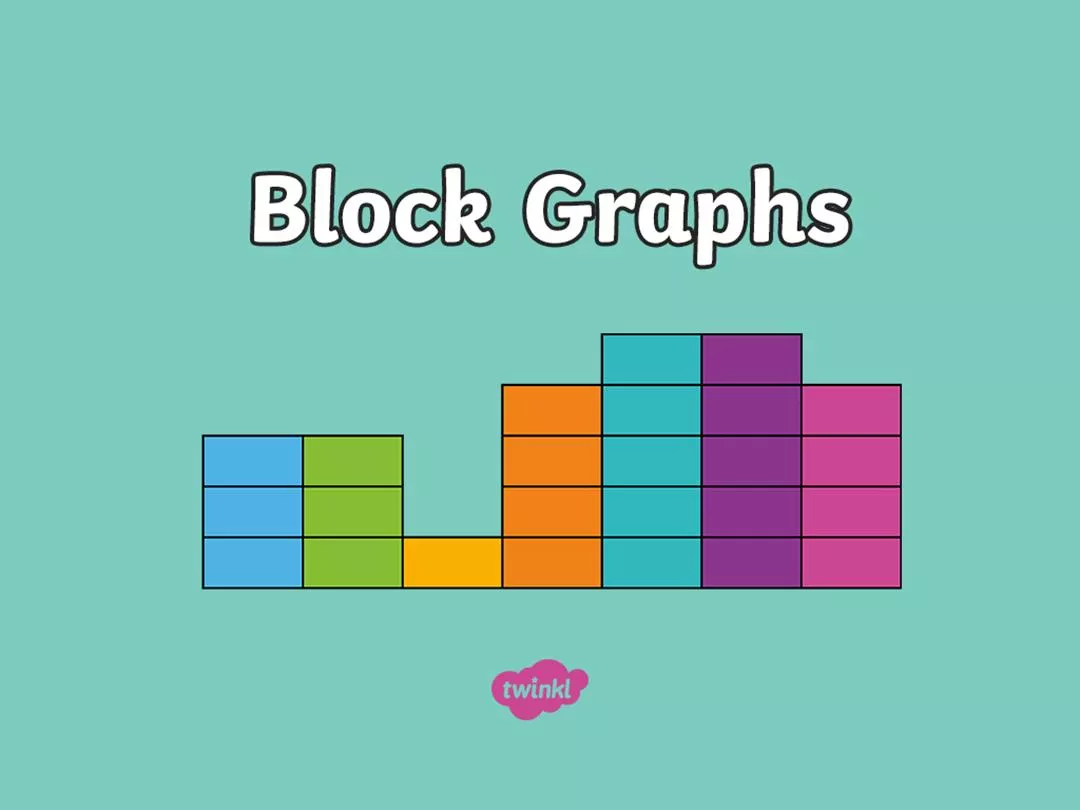


Block Graphs
What does a
block graph
show?
A
block graph
is a collection of discrete data (values that have no in-
between data) that has been input into a visual graph, represented in
blocks.
What must a
block graph
have?
•
A block graph must always have a
title
explaining what it shows.
•
Blocks must be carefully drawn to show the data.
•
There must be
no gap
between each bar.
•
Each bar must be the
same width
.
Block Graphs
How do you represent the data in a
block graph
?
A
number line
is marked on the
vertical
axis (y). The scale of this
number line is chosen based on the data range.
The
data categories
are organised on the
horizontal
axis (x).
Each axis must have a
label
explaining what it shows.
Block Graphs
Class A carried out a survey about their favourite activities. They recorded the
data in this block graph.
Which was the most popular activity?
How many more children like hockey
than netball?
How many fewer children prefer
swimming than football?
True or false? Class A has 32 children in
total. Explain how you know.
Which was the most popular activity?
Hockey was the most popular activity
How many more children like hockey
than netball?
5 children
How many fewer children prefer
swimming than football?
4 children
True or false? Class A has 32 children in
total. Explain how you know.
False. 7 + 5 + 10 + 5 + 3 = 30.
Class A’s Favourite Activities
Activities
Children
Block Graphs
Class B went to the zoo. They recorded how many zoo animals they saw using a
block graph.
Which was the most common animal?
How many more snakes than giraffes
were there?
How many fewer zebras than snakes
were there?
True or false? Class B’s most common
animal was the snake and the least
common was the rhino. Explain your
answer.
Which was the most common animal?
snake
How many more snakes than giraffes were
there?
10 more snakes than giraffes
How many fewer zebras than snakes were
there?
6 fewer zebras than snakes.
True or false? Class B’s most common animal
was the snake and the least common was the
rhino. Explain your answer.
False. The most common animal was the
snake but the least common was the giraffe
as they saw 4 rhinos and 2 giraffes.
Zoo Animals
Animals
Number of Animals Seen
Block Graphs
Sam had a box of chocolates. She recorded the chocolate wrapper colours in a
table and created a block graph of her data.
Which was the most common chocolate
wrapper colour?
How many more orange wrappers than
green wrappers were in the box?
How many fewer yellow wrappers than
blue wrappers were in the box?
True or false? If Sam gave half her
orange chocolate wrappers to her
brother she would have 22 wrappers
left. Explain your reason.
Which was the most common chocolate
wrapper colour?
Orange
How many more orange wrappers than green
wrappers were in the box?
10 more orange wrappers than green
wrappers.
How many fewer yellow wrappers than blue
wrappers were in the box?
3 fewer yellow wrappers than blue wrappers.
True or false? If Sam gave half her orange
chocolate wrappers to her brother she would
have 22 wrappers left. Explain your reason.
True. If she gives half the orange wrappers to
her brother, she would have 5 left and 5 + 6 +
4 + 7 = 22.
Sorting Chocolate
Chocolate Wrapper Colours
Number of Chocolate
Wrappers in the Box
Block Graphs
Mark likes to play video games. He recorded the time he spent playing video
games at home last week.
On which day did Mark play video
games the most?
How many more minutes did Mark play
video games on Saturday than on
Tuesday?
How many fewer minutes did Mark
play video games on Wednesday than
on Friday?
True or false? Mark played video games
twice as long on Monday than
Wednesday. Explain your reason.
On which day did Mark play video games the
most?
Saturday
How many more minutes did Mark play video
games on Saturday than on Tuesday?
40 minutes more on Saturday than Tuesday
How many fewer minutes did Mark play video
games on Wednesday than on Friday?
70 minutes fewer on Wednesday than Friday
True or false? Mark played video games twice as long
on Monday than Wednesday. Explain your reason.
True. He played for 40 minutes on Monday and
20 minutes on Wednesday. 40 is double 20.
Playing Video Games
Day of the Week
Time (minutes)
A block graph visually represents discrete data in a collection of blocks with no gaps between them. Each block must be carefully drawn with a title and axes labeled to explain the data shown. Examples include surveys on favorite activities, zoo animal sightings, and chocolate wrapper colors. Learn how to interpret block graphs and answer related questions based on the data presented.

Download Presentation

Please find below an Image/Link to download the presentation.
The content on the website is provided AS IS for your information and personal use only. It may not be sold, licensed, or shared on other websites without obtaining consent from the author.If you encounter any issues during the download, it is possible that the publisher has removed the file from their server.
You are allowed to download the files provided on this website for personal or commercial use, subject to the condition that they are used lawfully. All files are the property of their respective owners.
The content on the website is provided AS IS for your information and personal use only. It may not be sold, licensed, or shared on other websites without obtaining consent from the author.
E N D
Presentation Transcript
Block Graphs What does a block graph show? A block graph is a collection of discrete data (values that have no in- between data) that has been input into a visual graph, represented in blocks. What must a block graph have? A block graph must always have a title explaining what it shows. Blocks must be carefully drawn to show the data. There must be no gap between each bar. Each bar must be the same width.
Block Graphs How do you represent the data in a block graph? A number line is marked on the vertical axis (y). The scale of this number line is chosen based on the data range. The data categories are organised on the horizontal axis (x). Each axis must have a label explaining what it shows.
Block Graphs Class A carried out a survey about their favourite activities. They recorded the data in this block graph. Which was the most popular activity? Hockey was the most popular activity Class A s Favourite Activities Which was the most popular activity? How many more children like hockey than netball? How many more children like hockey than netball? 5 children Children How many fewer children prefer swimming than football? swimming than football? 4 children How many fewer children prefer True or false? Class A has 32 children in total. Explain how you know. True or false? Class A has 32 children in total. Explain how you know. False. 7 + 5 + 10 + 5 + 3 = 30. Activities
Block Graphs Class B went to the zoo. They recorded how many zoo animals they saw using a block graph. Which was the most common animal? snake Which was the most common animal? Zoo Animals How many more snakes than giraffes were there? How many more snakes than giraffes were there? 10 more snakes than giraffes Number of Animals Seen How many fewer zebras than snakes were there? there? 6 fewer zebras than snakes. How many fewer zebras than snakes were True or false? Class B s most common animal was the snake and the least common was the rhino. Explain your answer. False. The most common animal was the snake but the least common was the giraffe as they saw 4 rhinos and 2 giraffes. True or false? Class B s most common animal was the snake and the least common was the rhino. Explain your answer. Animals
Block Graphs Sam had a box of chocolates. She recorded the chocolate wrapper colours in a table and created a block graph of her data. Which was the most common chocolate wrapper colour? Orange Which was the most common chocolate wrapper colour? How many more orange wrappers than green wrappers were in the box? 10 more orange wrappers than green wrappers. Sorting Chocolate Number of Chocolate How many more orange wrappers than green wrappers were in the box? Wrappers in the Box How many fewer yellow wrappers than blue wrappers were in the box? wrappers were in the box? 3 fewer yellow wrappers than blue wrappers. How many fewer yellow wrappers than blue True or false? If Sam gave half her orange chocolate wrappers to her brother she would have 22 wrappers left. Explain your reason. True. If she gives half the orange wrappers to her brother, she would have 5 left and 5 + 6 + 4 + 7 = 22. True or false? If Sam gave half her orange chocolate wrappers to her brother she would have 22 wrappers left. Explain your reason. Chocolate Wrapper Colours
Block Graphs Mark likes to play video games. He recorded the time he spent playing video games at home last week. On which day did Mark play video games the most? On which day did Mark play video games the most? Saturday Playing Video Games How many more minutes did Mark play video games on Saturday than on Tuesday? 40 minutes more on Saturday than Tuesday How many more minutes did Mark play video games on Saturday than on Tuesday? Time (minutes) How many fewer minutes did Mark play video games on Wednesday than on Friday? 70 minutes fewer on Wednesday than Friday How many fewer minutes did Mark play video games on Wednesday than on Friday? True or false? Mark played video games twice as long on Monday than Wednesday. Explain your reason. True. He played for 40 minutes on Monday and 20 minutes on Wednesday. 40 is double 20. True or false? Mark played video games twice as long on Monday than Wednesday. Explain your reason. Day of the Week