Binomial Distribution: Examples and Visualizations
Explore various problems and examples related to the binomial distribution, including calculating probabilities, approximations using Poisson distribution, and visual representations. Discover how binomial distribution tends towards normal under different conditions and learn how to solve problems using factorial and combination concepts. Excel formulas are also provided for easy calculations.

Download Presentation

Please find below an Image/Link to download the presentation.
The content on the website is provided AS IS for your information and personal use only. It may not be sold, licensed, or shared on other websites without obtaining consent from the author.If you encounter any issues during the download, it is possible that the publisher has removed the file from their server.
You are allowed to download the files provided on this website for personal or commercial use, subject to the condition that they are used lawfully. All files are the property of their respective owners.
The content on the website is provided AS IS for your information and personal use only. It may not be sold, licensed, or shared on other websites without obtaining consent from the author.
E N D
Presentation Transcript
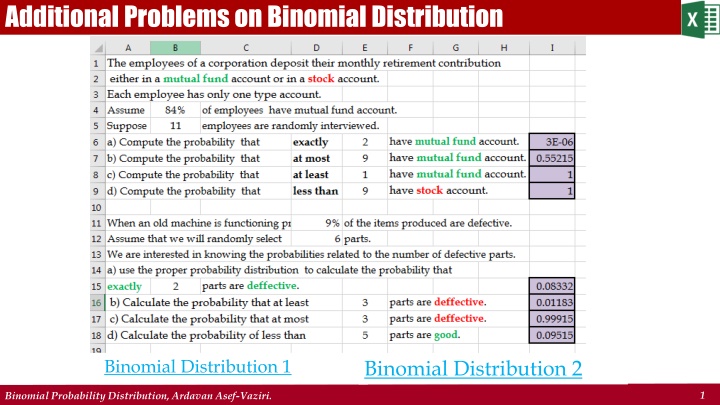
Additional Problems on Binomial Distribution Binomial Distribution 1 Binomial Distribution 2 1 Binomial Probability Distribution, Ardavan Asef-Vaziri.
Additional Problems on Binomial Distribution n= 10 p= 0.3 P(X= 3 P(X< 3 P(X<= 3 P(X> 3 P(X>= 3 P(X<> 3 ) 0.26683 =BINOM.DIST(H3,$B$1,$D$1,0) ) 0.38278 =BINOM.DIST(H4-1,$B$1,$D$1,1) ) 0.64961 =BINOM.DIST(H5,$B$1,$D$1,1) ) 0.35039 =1-J5 ) 0.61722 =1-J4 ) 0.73317 =1-J3 0.5003 =BINOM.DIST(3,$B$1,$D$1,1)-BINOM.DIST(1,$B$1,$D$1,1) 0 P(2=<X<=3) P(2<X<3) Average np(p-1) Varriance np(p-1) StdDev SQRT(VAR) 3 =K1*M1 2.10 =K1*M1*(1-M1) 1.45 =SQRT(J13) 2 Binomial Probability Distribution, Ardavan Asef-Vaziri.
More Visual Representation 3 Binomial Probability Distribution, Ardavan Asef-Vaziri.
Binomial Distribution Tends to Normal for Large n 4 Binomial Probability Distribution, Ardavan Asef-Vaziri.
Binomial Distribution Tends to Normal for p Close to 0.5 5 Binomial Probability Distribution, Ardavan Asef-Vaziri.
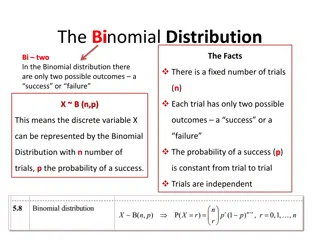
Binomial to Poisson During a severe thunderstorm, any transmission line is damaged with probability 0.04, independently of other transmission lines. A city with 75 transmission lines is hit by a severe thunderstorm. What is the probability that at least 5 of them get damaged? X is Binomial(n = 75, p = 0.04), large n and small p, so X is approximately Poisson. Large n can also lead to Normal approximation. Solve in all three ways 6 Binomial Probability Distribution, Ardavan Asef-Vaziri.
More Example 7 Binomial Probability Distribution, Ardavan Asef-Vaziri.
Factorial and Combination 8 Binomial Probability Distribution, Ardavan Asef-Vaziri.
Binomial Distribution Formula and Excel 9 Binomial Probability Distribution, Ardavan Asef-Vaziri.