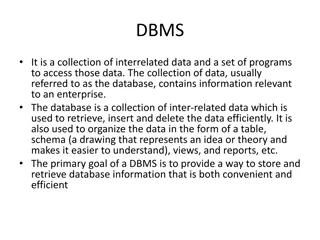
Best Practices for OpenEdge Database Management


369 OpenEdge Database Best Practices
Tom Bascom, White Star Software
Wednesday 9:45am
Abstract:
Whether you have a single 10 user system or a horde of large systems with thousands of users, come to this
session to gather the latest tips and techniques for keeping your databases up and running, your users happy, your
boss smiling, and your nights and weekends worry free!

OpenEdge Database Best Practices
Tom Bascom, White Star Software
tom@wss.com


A Few Words about the Speaker
•
Tom Bascom: Progress user & roaming DBA since 1987
•
Partner: White Star Software, LLC
–
Expert consulting services related to all aspects of Progress and OpenEdge.
–
Remote database management service for OpenEdge.
–
Author of:
–
Simplifying the job of managing and monitoring the world’s best business
applications.
–
tom@wss.com

The List!
Stay Current
•
Up to date releases of Progress, your OS and your application are
essential components of a well tuned system.
•
You cannot take advantage of the best techniques, improved
algorithms or new hardware without staying up to date.
•
Failure to stay up to date may mean poor performance, increased
costs and general uncompetitiveness.
Stay Current
•
TRX throughput in v8 -> v9 (CCLP)
•
Major 4GL execution speed improvements in 9.1E and OE10
•
64 bit platform support and large memory.
•
OE 10
–
Type 2 Storage Areas
•
Significant improvements in DB read performance
•
10.2b06 and oe11 added –lruskips and –prefetch*
•
11.4 adds table partitioning
•
11.6 rolls out big improvements to OE Replication
•
11.7 brings CDC and -hashLatchFactor
•
12.0 Introduces SSJ and MT Servers
•
Type 2 storage areas are the foundation for all advanced
features of the OpenEdge database.
•
Data blocks in Type 2 areas contain data from just one table!
•
Type 2 areas have “cluster sizes” of 8, 64 or 512.
•
Cluster sizes of 0 or 1 are Type 1 areas
Type 2 Storage Areas
d "Data":20,128
;512
/db/dbname_20.d1
d "Indexes":21,1
;8
/db/dbname_21.d1
d "LOBs":22,64
;512
/db/dbname_22.d1
Type 2 Storage Areas
•
Always
use type 2 areas…
•
… for areas that contain data, indexes or LOBS.
•
The schema area is a type 1 area
Type 2 Storage Areas
•
Always
use type 2 areas…
•
… for areas that contain data, indexes or LOBS.
•
The schema area is a type 1 area
•
Thus NO application data should ever be in the schema
area!
Type 2 Storage Areas
•
Always
use type 2 areas…
•
… for areas that contain data, indexes or LOBS.
•
The schema area is a type 1 area
•
If you think that you have a legitimate exception I expect to see
a detailed talk about it next year.
The Buffer Cache
•
The cure for disk IO is RAM.
•
Use RAM to buffer and cache IO ops.
•
Efficiency of –B:
–
Is loosely measured by
hit ratio
.
–
Changes follow an inverse square law.
–
To make a noticeable change you must make a
large
change to –B.
•
100,000 is “a good start” (800MB @ 8k blocks)
•
1,000,000 (a mere 8GB) is not at all unusual
•
10,000,000 (80GB) is my current largest customer value in production
The Buffer Cache
In Big B You Should Trust!
(Approximately 4 records per read op in non –B cases.)
-spin
•
All new computers: servers, desktops, laptops; even phones and
watches are now multi-core.
•
Do
NOT
use the old X * # of CPUs rule to set –spin.
It is bogus.
•
Bigger is not always better with –spin!
•
Modest values (5,000 to 10,000)
generally
provide the best and
most consistent results for the vast majority of people.
•
Use
readprobe.p
to explore.
•
Check out Rich Banville’s Superb Exchange 2008 Presentation!
-lruskips 100
•
It is simple and effective.
•
Eliminates a lot of pointless internal housekeeping.
•
Big benefit for busy systems!
•
No negative impact on quiet systems.
•
Makes the impact of bad code slightly less awful.
•
Go ahead and set –lruskips2 100 while you’re at it.
Set *rangesize
•
The default value of 50 is useless.
•
Without the full set of tables enabled for monitoring many
diagnostic techniques cannot be used.
•
You need to restart the db to change these so do it proactively:
–
Not when you already have a problem.
–
Round up a bit to avoid needing to adjust with every schema change.
–
Keep an eye on your coverage! Don’t get out of sync.
•
ProTop will generate a suggested .pf file for you
Otherargs
•
The most important property in conmgr.properties
•
Use for parameters that are not supported by exploder.
•
Also allows you to point to a .pf file and maybe even avoid having to
use OpenEdge Explorer at all!
Implement -bithold
•
The bi file should not be allowed to grow beyond approximately 1/4
th
the free
space of the filesystem holding it.
•
That is because crash recovery may require 2x to 3x the size of the bi file to
complete and requesting extra disk space at that point in time is generally not
possible.
•
If you have never had a problem with excess bi growth, this is a way to ensure that
you never do.
•
If you decide to implement –bistall or –aistall you need good documentation!
–
You will not be present when it happens.
–
And even if you are you might not remember how to recognize a stall or how to address it.
-bithold 500
bi cluster size
•
The idea is to reduce the number and frequency of checkpoints giving APWs
plenty of time to work.
•
Larger bi clusters permit spikes in the workload to take place without
ambushing the APWs.
•
Easy to overlook when building new db via prostrct create…
•
512 is the default OE 10 bi cluster size.
•
8192 is reasonable for small systems.
•
16384 is “a good start” for larger systems.
•
Longer REDO phase on startup so don’t get crazy.
•
NOT
a good idea for “Workgroup” database licenses.
–
For WG small values (512 or 1024) are better.
bi cluster size
$ grep ‘(4250)’ dbname.lg
(4250)
Before-Image Cluster Size: 524288.
( = 512k )
The value above is the oe10 default value of 512k so let’s make it larger:
$ proutil dbname -C truncate bi -bi 16384
…
(1620) Before-image cluster size set to 16384 kb.
(1621)
Before-Image Cluster Size: 16777216.
( = 16384k )
$ proutil dbname -C -bigrow 8
Miscellaneous proutil (and rfutil)
$ proutil dbName -C truncate bi -biblocksize 16
$ rfutil dbName -C aimage truncate -aiblocksize 16
$ proutil dbName -C enablelargefiles
$ proutil dbName -C enablelargekeys
$ proutil dbName -C updateschema
$ proutil dbName -C updatevst
$ proutil dbName -C enableb2 “Schema Area”
$ proutil dbName -C -bigrow 8
PROBKUP
•
The approved way to backup an OpenEdge database.
•
PROBKUP knows where all parts of the database are.
•
PROBKUP can be run online.
•
Always use –com and –Bp 10
probkup online dbName dbName.pbk –com –Bp 10
”Backups” That Will Get You Fired
•
Virtual Machine Snapshots
•
SAN Snapshots
•
3
rd
Party Backup Tools
•
OS Level Copy Commands
•
Untested Scripts
•
Deleting old backups before you have a new backup
Backup Caveats
•
3
rd
Party tools need to:
–
First use probkup to disk
–
Or shutdown db
–
Or properly script a quiet point
•
MUST wait for confirmation in the .lg file, return of proquiet is NOT sufficient
–
MUST backup ALL files (it is easy to miss some, especially if they are added later)
•
If you are on Windows and using Task Scheduler:
–
Do NOT use a real user (or Administrator)
–
Use a userid that NEVER LOGS IN
–
Use a userid that does not have an expiring password
•
Windows does not like to overwrite old backups
Use After-Imaging
•
The Key to a robust recovery strategy.
•
Similar to other database’s “REDO LOG”.
•
ROLL FORWARD RECOVERY:
–
Restore a backup – even a very old backup.
–
Roll forward archived after-image logs.
–
Until you have recovered to a point in time or a specific transaction.
•
Protects your database from:
–
Hardware errors
–
Human errors (much more common)
–
Malfeasance of all sorts
More About After-Imaging
•
The DBA’s Best Friend.
•
Easy to implement, easy to manage.
•
Running a database without after-imaging is grossly irresponsible.
•
Without after-imaging your data, and the business that depends on
that data, is at risk!
•
After-imaging prevents DBA self-unemployment!
Periodically TEST your recovery procedures
•
Untested recovery procedures WILL fail
APW, AIW, BIW & WDOG
•
Always start a BIW
•
Always start an AIW
•
Start WDOG
•
One or Two APWs are usually enough:
–
Do
NOT
follow the old “1 APW per disk” suggestion.
–
Too many is just a (small) waste of CPU cycles.
–
If you are consistently flushing buffers at checkpoints increase bi cluster
size and add an APW (one at a time until buffer flushes stop).
The Care and Feeding of SQL
•
Many 3
rd
party tools require SQL
•
SQL is very different from OpenEdge
•
SQL is often not configured or is poorly configured
•
The default SQL DBA user is “sysprogress”
SQLEXP – It Is Always Available
proenv>
sqlexp -user sysprogress -password sysprogress -db sports2000 -H localhost -S 21012
OpenEdge Release 11.7 as of Mon Mar 27 10:21:54 EDT 2017
Connecting user "sysprogress" to URL "jdbc:datadirect:openedge://localhost:21012;databaseName=sports2000"
SQLExplorer>
select count(*) from customer;
SQLExplorer>
select count(*) from pub.customer;
count(*)
--------------------
201120
SQLExplorer>
quit
•
A simple way to verify SQL issues without depending on external
software!
DBTOOL and SQL Width
proenv>
dbtool sports2000
DATABASE TOOLS MENU - 11.7
---------------------------
1. SQL Width & Date Scan w/Report Option
2. SQL Width Scan w/Fix Option
. . .
Q. Quit
Choice:
2
The option will process all records including template records in the specified range.
<connect>: (0=single-user 1=self-service >1=#threads)?
1
Padding % above current max:
25
<table>: (Table number or all)?
all
<area>: (Area number or all)?
all
<display>: (verbose level 0-4)?
Total records read: 3561171
SQLWidth errors found: 7, Date errors found: 0
SQLWidth errors fixed: 7
OE 11.4+ Autonomous SQL Width Updates
•
-SQLTruncateTooLarge
ON
|
ALL
|OFF|
OUTPUT
•
-SQLWidthUpdate
ON
|OFF
•
Truncation is tricky – if you use ON or ALL the data is truncated
when evaluating the WHERE clause which can unexpectedly impact
your result set. OUTPUT only impacts the data that is returned to
the client.
Update Statistics
•
SQL-92 uses a cost based optimizer
•
But it cannot optimize without knowledge of the cost! (data
distribution).
•
Monthly or quarterly “update statistics” is appropriate for most
people.
•
Or when 20% of your data has changed.
•
This is a data intense process:
–
Run it during off hours if you can
–
You might want to only do a few tables/indexes at a time
UPDATE STATISTICS
/* genUpdateSQL.p
*
* mpro dbName –p genUpdateSQL.p -param ”updstats.sql"
*
* sqlexp -user user -password passWord -db dbName -S port -infile updstats.sql –outfile updstats.log
*/
output to value( session:parameter ).
for each _file no-lock where _hidden = no:
put unformatted
"UPDATE TABLE STATISTICS AND INDEX STATISTICS AND ”
“ALL COLUMN STATISTICS FOR PUB."
'"' _file._file-name '"' ";"
skip
"
commit work;
”
skip.
end.
output close.
Index Compact
•
Compacts Indexes.
•
Removes deleted record placeholders.
•
Improves “utilization” = fewer levels & blocks and more index
entries per read.
•
Runs online or offline.
•
Available since version 9.
Index Compact
•
Do
NOT
set target % for 100!
•
Consider compacting when utilization < 70%
•
… and blocks > 1,000.
proutil dbname –C idxcompact table.index target%
INDEX BLOCK SUMMARY FOR AREA "APP_FLAGS_Idx" : 96
-------------------------------------------------------
Table Index Fields Levels Blocks Size %Util Factor
PUB.APP_FLAGS
AppNo 183 1 3
4764
37.1M
89.9
1.2
FaxDateTime 184 2 2
45
259.8K
72.4
1.6
FaxUserNotified 185 2 2
86
450.1K
65.6
1.7
INDEX BLOCK SUMMARY FOR AREA "Cust_Index" : 10
-------------------------------------------------------
Table Index Fields Levels Blocks Size % Util Factor
PUB.Customer
Comments 13 1 1 1 874.0B 21.5 1.0
CountryPost 14 2 2 4 9.0K 56.5 1.9
CustNum 12 1 2 4 9.9K 62.2 1.8
Name 15 1 2 9 22.5K 62.9 1.7
SalesRep 16 1 1 1 1.3K 33.6 1.0
Minimize Network Traffic
•
Use a secondary broker to isolate high activity clients (such as
reports).
•
Use –ServerType SQL or 4GL. Do NOT use “BOTH”.
•
Set –Mm to 8192 or larger.
•
Use –Mn and –Ma to keep the number of clients per server low on
old pre OE12 systems without multi-threaded servers.
•
Use –Mi 1 to spread 4GL connections across servers.
Minimize Network Traffic
•
-prefetchDelay
•
-prefetchFactor 100
•
-prefetchNumRecs 1000
Minimize Network Traffic
•
Use FIELDS list in queries.
•
NO-LOCK queries pack multiple records into a request.
•
Watch out for client-side sorting and selection on queries.
•
Remember that CAN-DO is evaluated on the CLIENT (yet another
reason not to use it).
•
Use -noautoresultlist/FORWARD-ONLY for dynamic queries.
Impact of Message Size & Prefetch Options
for each _index fields(_field-name) no-lock:
end.
Impact of Message Size & PrefetchNumRecs
-prefetchNumRecs
dominates!
Manage Temp File IO
•
Temp-file IO can exceed db IO.
•
Sometimes by 2:1, 3:1 or more!
•
-T isolates temp file IO.
•
-t helps you to crudely diagnose the source of IO.
•
-y provides some detail regarding r-code swapping.
•
-mmax buffers r-code, 4096 is a good start for ChUI, 16384 for GUI.
•
Memory mapped procedure libraries cache r-code.
•
Use –Bt & -tmpbsize to tune 4GL temp-tables.
Manage Temp File IO
-rw-r--r-- 1 VEILLELA users 579312 Oct 19 15:16 srtrAyhEb
-rw-r--r-- 1 wrightb users 35697664 Oct 19 15:16 srtH6miqb
-rw-r--r-- 1 STEELEJL users 36772864 Oct 19 15:16 srtz37kyb
-rw-r--r-- 1 THERRIKS users 0 Oct 19 07:12 srt--Elab
-rw-r--r-- 1 root users 17649 Oct 19 15:16 lbiV6Qp7a
-rw-r--r-- 1 root users 34704 Oct 19 15:16 lbi-TymMa
-rw-r--r-- 1 wrightb users 811008 Oct 19 15:16 DBIHDmiqc
-rw-r--r-- 1 BECKERLM users 8192 Oct 19 11:06 DBI--Abac
-rw-r--r-- 1 CALUBACJ users 8192 Oct 19 09:16 DBI--Abyc
CLIENT.MON (-y)
Program access statistics: Times Bytes
Reads from temp file: 0 0
Writes to temp file: 0 0
Loads of .r programs: 14 524594
Saves of compilation .r's: 0 0
Compilations of .p's: 0 0
Checks of files with stat: 165
0
Monitor
•
Familiarize yourself with baseline performance so that you will
recognize exceptions when they occur.
•
Collect historical statistics to facilitate both forward planning
(trending) and forensic performance analysis.
•
Implement availability and performance monitoring systems so that
issues are identified and resolved
before
they cause outages.
Rapid Readers
•
Similar to a “runaway” – consumes a whole CPU
•
But is actually doing db “logical” IO
•
Usually caused by:
–
Table scans
–
Poor index selection
–
Unmonitored batch processes and app-servers
–
Really bad algorithm choices
Rapid Readers
Direct Auto Sampling JSON 15255 4576 0.227 ProTop Version 3.3h 2015/09/27 18:49:53
dbappraise 28 0 /db/dbappraise dbappraise
Hit% 99.06 Commits: 0 New RM: 0 Oldest TRX: 00:00:00 Connections: 10
Log Reads: 194,472 Undos: 0 From RM: 0 Curr BIClstr: 0 Brokers: 1
OS Reads: 1,835 Lock Tbl HWM: 48 From Free: 0 Oldest BIClstr: 0 4gl Servers: 0
Rec Reads: 95,269 Curr # Locks: 0 Examined: 0 Checkpoints: 1,139 SQL Servers: 0
LogRd/RecRd: 2.04 Modified Bufs: -16 Front2Bk: 0 Curr AI Extent: Disabled 4gl Clients: 6
Log Writes: 0 IO Response: 3.33 Remove Lk: 0 Curr AI Seq#: 0 SQL Clients: 0
OS Writes: 0 BogoMIPS: 0.00 Empty AI Exts: -1 App Server: 0
Rec Creates: 0 BogoMIP%: 0.00 Full AI Exts: -1 BIW: 1
Rec Updates: 0 AIW: 0
Rec Deletes: 0 Notes: 0 0 APW Writes: 0 APWs: 2
Rec Locks: 10 BIW/AIW Write% 0 0 APW Write% 0 WDOG: 0
Rec Waits: 0 Writes to Log: 0 0 Bufs Scanned: 0 Local: 2
Idx Blk Spl: 0 BIW/AIW Writes: 0 0 APW Scan Wrts: 0 Remote: 0
Resrc Waits: 0 Partial Buf Wr: 0 0 APW Q Wrts: 0 Batch: 4
Latch Waits: 2 Busy Buf Waits: 0 0 Chkpt Q Wrts: 0 TRX: 0
Empty Buf Wts: 0 0 Flushed Bufs: 0 Blocked: 0
┌───────────────────────────────────────────────────────── Table Activity ─────────────────────────────────────────────────────────┐
│ Tbl# Area# Table Name #Records Turns Create Read v Update Delete OS Read │
│ ─────────────────────────────────────────────────────────────────────────────────────────────────────────────────────────────── │
│ > 8 22 activity 0.00 0 57,351 0 0 1,731 │
│ 6 10 site 0.00 0 37,874 0 0 0 │
┌──────────────────────────────────────────────────────── User IO Activity ────────────────────────────────────────────────────────┐
│ Usr# Name PID Flags Blk Ac v OS Rd OS Wr Hit% Rec Lck Rec Wts Line# Program Name │
│ ─────────────────────────────────────────────────────────────────────────────────────────────────────────────────────────────── │
│ > 16 tom 14505 S4B 194216 1826 0 99.06% 0 0 34 ./test/churn.p │
│ 12 tom 22668 S4 62 0 0 100.00% 6 0 630 lib/vstlib.p │
proGetStack - Client Stack Trace
proenv>
proGetStack 1576
proenv>
type \protop\s2k_demo\protrace.1576
=====================================================
PROGRESS stack trace as of Fri Mar 1 15:46:49 2019
=====================================================
Startup parameters:
-pf P:\oe117\startup.pf,-cpinternal ISO8859-1,-cpstream ISO8859-1 . . . (end .pf),-b,-db d:\bigsports\sports2000,-rand 2,-p updorder.p
** ABL Stack Trace **
--> updSalesRep updorder.p at line 67 (.\updorder.p)
updorder.p at line 29 (.\updorder.p)
** Persistent procedures/Classes **
** PROPATH **
.,P:\oe117\tty,P:\oe117\tty\adecomm.pl,P:\oe117\tty\adecomp.pl,P:\Progress\oe117\tty\prodict.pl,P:\Progress\oe117,P:\Progress\oe117\bin
** Databases (logical/type/physical) **
sports2000 PROGRESS d:\bigsports\sports2000
** End of Protrace **
Parallelize
•
Many legacy processes were designed when the system was
much smaller or when multiple CPUs were unusual.
•
Step outside of the single-threaded box and consider what
portions of your system could benefit from being parallelized:
•
MRP Runs
•
Nightly Processing
•
Reports
•
Data Extracts
•
Data Imports
Parallelize
$ mbpro dbname –p exp.p –param “01|0,3000”
$ mbpro dbname –p exp.p –param “02|3000,6000”
$ mbpro dbname –p exp.p –param “03|6000,9999”
/* exp.p */
define variable startCust as integer no-undo.
define variable endCust as integer no-undo.
startCust = integer( entry( 1, entry( 2, session:parameter, “|” ))).
endCust = integer( entry( 2, entry( 2, session:parameter, “|” ))).
output to value( “export.” + entry( 1, session:parameter, “|” ).
for each customer no-lock where custNum >= startCust and custNum < endCust:
export customer.
end.
output close.
quit.
Larger db Blocks
•
Larger blocks result in
much
more efficient IO.
•
Fewer IO ops mean less contention for disk.
•
Moving from 1k to 4k is huge. 4k to 8k is relatively less huge but
still valuable.
•
8k works best in most cases. Especially read-heavy workloads.
•
Better disk space efficiency (tighter packing, less overhead).
•
Don’t forget to adjust –B and Rows Per Block!
Larger db Blocks
•
Large Blocks reduce IO, fewer operations are needed to move the
same amount of data.
•
More data can be packed into the same space because there is
proportionally less overhead.
•
Because a large block can contain more data it has improved odds
of being a cache “hit”.
•
Large blocks enable HW features to be leveraged. Especially SAN
HW.
Dump & Load
•
You
shouldn’t
need to
routinely
dump & load.
•
If you’re on OE10+,
•
Using type 2 areas,
•
That have been well defined,
•
And you have a well-behaved application.
•
The rest of us benefit from an occasional D&L.
Dump & Load
•
Do not be afraid to use the proutil binary dump & load.
•
“Binary” refers to the record contents – not the block structure.
•
Binary dump is portable:
–
Upwards across Progress versions (i.e. v9 to oe11)
–
Between all Platforms (i.e. Solaris to Windows)
–
Between “bitness” (i.e. 32 bit Windows v9 to 64 bit Linux OE11)
•
Most people can get by with some simple scripts.
Be Wary of Virtualization
•
Virtualization is not magic!
•
The default assumption with virtualization is that you do not
really
need all of the resources available to you.
•
Overcommitting resources
will
hurt performance.
•
Virtualization can not create capacity from thin air.
•
As a DBA you must size db servers for
peak
load. With shared
resources you must size for
simultaneous peaks
in multiple VMs!
(Sys-admins often assume simultaneous
valleys
for all
resources…)
Not magic…
•
A Partner tells a customer “you can support 50 connections on that
server”.
•
The customer has 200 users...
•
So they virtualize the server and bring up 4 VMs!
Right Size Your Virtual Environment
•
A database server is NOT the same as a file server
•
Do NOT over allocate Resources
•
Do NOT “thin provision”
•
Do NOT allocate too many CPUs – think about co-scheduling
•
Ensure that you always have spare capacity
IO Subsystems
•
Use more than one disk:
–
A fast mechanical disk can do 150 to 200
random
IO Ops/sec.
–
Kbytes/sec is a measure of
sequential
IO.
–
OLTP is mostly
random
.
•
Don’t waste time trying to “manually stripe”.
•
Instead, use “hardware” striping and mirroring.
•
Isolate AI extents for
safety
, not performance.
•
Isolate temp-file, application, OS and “other” IO.
The SAN Scam
•
External, Shared storage is NOT a performance enhancer
•
DB IO ops are random and seek time is critical
–
The better tuned your db, the more random the IO becomes
•
Accessing data over a network connection is only “fast” in the
fevered imagination of a delusional sales person
•
Lightspeed = 1 foot per nanosecond
RAID 5
•
Great performance when there is no load:
–
And when there are no disk failures.
–
And if your database is roughly the same size as the SAN cache.
–
Which nobody else is using.
–
All of the RAM that you can use – cleverly placed where it will do you the
least amount of good (i.e. “all flash”).
–
All of the performance of a single disk with none of the cost savings.
RAID 6
•
How can we possibly make RAID 5 Worse?
•
Add another parity disk!
BAARF.com - Enough is Enough
•
Battle Against Any Raid (Free, Four, Five or Fix)
–
http://www.miracleas.com/BAARF/RAID5_versus_RAID10.txt
–
http://www.facebook.com/pages/BAARF
–
http://gurucollege.net/rants/baarf-or-why-raid5-isnt-safe/
–
http://www.unitrends.com/documents/whitepapers/unitrends-wp-russian-roulette-and-raid-5.pdf
•
Don’t be cheated first and surprised later!
Internal Solid State Disks
•
Virtualization is not magic – but SSD is pretty darn close!
•
Literally thousands of times faster than rotating rust.
•
Perfectly safe and reliable.
•
But -- disable Windows disk defrag programs.
•
Will not cure
all
performance problems – but they sure do help with IO
throughput.
•
It is still necessary to optimize code properly and use lots of RAM for –B.
•
Not a cure-all for SAN storage. The SSD is at the wrong end of the cable.
Strive for 5 Nines
•
Many procedures that previously required an outage no longer do:
–
Backups
–
Schema changes
–
Building indexes
–
Parameter changes
•
Revisit your administrative procedures and ensure that you are not
needlessly imposing outrages on the business!
Questions?
Thank You!
Bonus Slides!
#1 Stupid 4GL Tricks
•
Bad code will defeat any amount of heroic tuning and excellent
hardware.
•
Luckily bad code is often advertised by the perpetrator as having
been developed to “improve performance”.
•
Just because a feature of the 4GL
can
do something doesn’t mean
that it
should
be used to do it.
#1 Stupid 4GL Tricks
/* SR#1234 –
enhanced lookup to improve performance!
*/
update cName.
find
first
customer where
cName matches customer.name
use-index
custNum
no-error.
-
Or –
/* different variations used in different bits of code… */
find
first
customer where
can-do
( cName, name )
use-index
custNum
no-error.
#1 Stupid 4GL Tricks
•
There is a lot of crap code in the world.
•
Stop dumpster-diving for code!
•
Don't emulate it, eliminate it.
#12 fork() & exec()
define variable i as integer no-undo.
define variable fSize as integer no-undo.
etime( yes ).
do i = 1 to 1000:
input through value( "ls -ld .." ).
import ^ ^ ^ ^ fSize.
input close.
end.
display etime fSize.
define variable i as integer no-undo.
define variable fSize as integer no-undo.
etime( yes ).
do i = 1 to 1000:
file-info:file-name = "..".
fSize = file-info:file-size.
end.
display etime fSize.
3140ms,
at least
1000 calls to each of open(), close(),
fork(), exec(), read() complete with multiple context
switches per invocation.
16ms, 1,000 stat() calls.
#13 Progress AppServer
•
Used to reduce network traffic and latency.
•
When properly implemented it will minimize the path length
between business logic and data persistence layers.
•
IOW, for best performance, the AppServer should live on the same
server as the database and use a self-service connection.
•
In a VM environment your app server might not be self-service but
it should be on the same physical host.
#23 “Chunking” Transactions
define variable i as integer no-undo.
outer: do for customer
transaction
while true:
inner: do while true:
i = i + 1.
find next customer exclusive-lock no-error.
if not available customer then
leave outer
.
discount = 0. /* the “work” part of things… */
if i modulo
100
= 0 then
next outer
.
end.
end. /* outer */
#24 Transactions
•
Distinguish between a “business transaction” and a “database
transaction”.
•
Do not try to abuse a database transaction to enforce a business
rule:
–
Huge Lock Tables are a sign of this.
–
You may need to create “reversing (business) transactions”.
–
Or restartable transactions.
•
For large database operations “chunk” your transactions.
#30 Pick Your Battles
The performance enhancement possible with a given
improvement is limited by the fraction of the
execution time that the improved feature is used.
-- Amdahl’s Law
#30 In other words:
•
Trying to improve small things that nobody
notices probably isn’t the road to fame and
fortune
•
Big queries that return lots of data and which
are frequently used by lots of users will be
much more noticeable
Parking Lot: Half Baked Topic Ideas
•
Plan and test before you buy
•
Self-audit license compliance
•
OE Replication
•
Attend PUGs
•
Don’t Forget the Code!
Gain insights into the latest tips and techniques for ensuring optimal performance, user satisfaction, and system reliability in OpenEdge databases. Learn how to keep your databases running smoothly, users happy, and management stress-free by staying up-to-date with releases, leveraging advanced features like Type 2 storage areas, and more. Discover the key advancements in transaction throughput, execution speed improvements, database read performance, and other crucial aspects essential for efficient database management. Presented by Tom Bascom from White Star Software, this session is a must-attend for all Progress and OpenEdge enthusiasts.

Download Presentation

Please find below an Image/Link to download the presentation.
The content on the website is provided AS IS for your information and personal use only. It may not be sold, licensed, or shared on other websites without obtaining consent from the author. Download presentation by click this link. If you encounter any issues during the download, it is possible that the publisher has removed the file from their server.
E N D
Presentation Transcript
369 OpenEdge Database Best Practices Tom Bascom, White Star Software Wednesday 9:45am Abstract: Whether you have a single 10 user system or a horde of large systems with thousands of users, come to this session to gather the latest tips and techniques for keeping your databases up and running, your users happy, your boss smiling, and your nights and weekends worry free!
OpenEdge Database Best Practices Tom Bascom, White Star Software tom@wss.com
A Few Words about the Speaker Tom Bascom: Progress user & roaming DBA since 1987 Partner: White Star Software, LLC Expert consulting services related to all aspects of Progress and OpenEdge. Remote database management service for OpenEdge. Author of: Simplifying the job of managing and monitoring the world s best business applications. tom@wss.com
Stay Current Up to date releases of Progress, your OS and your application are essential components of a well tuned system. You cannot take advantage of the best techniques, improved algorithms or new hardware without staying up to date. Failure to stay up to date may mean poor performance, increased costs and general uncompetitiveness.
Stay Current TRX throughput in v8 -> v9 (CCLP) Major 4GL execution speed improvements in 9.1E and OE10 64 bit platform support and large memory. OE 10 Type 2 Storage Areas Significant improvements in DB read performance 10.2b06 and oe11 added lruskips and prefetch* 11.4 adds table partitioning 11.6 rolls out big improvements to OE Replication 11.7 brings CDC and -hashLatchFactor 12.0 Introduces SSJ and MT Servers
Type 2 Storage Areas Type 2 storage areas are the foundation for all advanced features of the OpenEdge database. Data blocks in Type 2 areas contain data from just one table! Type 2 areas have cluster sizes of 8, 64 or 512. d "Data":20,128;512 /db/dbname_20.d1 d "Indexes":21,1;8 /db/dbname_21.d1 d "LOBs":22,64;512 /db/dbname_22.d1 Cluster sizes of 0 or 1 are Type 1 areas
Type 2 Storage Areas Always use type 2 areas for areas that contain data, indexes or LOBS. The schema area is a type 1 area
Type 2 Storage Areas Always use type 2 areas for areas that contain data, indexes or LOBS. The schema area is a type 1 area Thus NO application data should ever be in the schema area!
Type 2 Storage Areas Always use type 2 areas for areas that contain data, indexes or LOBS. The schema area is a type 1 area If you think that you have a legitimate exception I expect to see a detailed talk about it next year.
The Buffer Cache The cure for disk IO is RAM. Use RAM to buffer and cache IO ops. Efficiency of B: Is loosely measured by hit ratio. Changes follow an inverse square law. To make a noticeable change you must make a large change to B. 100,000 is a good start (800MB @ 8k blocks) 1,000,000 (a mere 8GB) is not at all unusual 10,000,000 (80GB) is my current largest customer value in production
The Buffer Cache In Big B You Should Trust! Layer Time # of Recs # of Ops Cost per Op Relative Progress to B 0.96 100,000 203,473 0.000005 1 -B to FS Cache 10.24 100,000 26,711 0.000383 75 FS Cache to SAN 5.93 100,000 26,711 0.000222 45 -B to SAN Cache 11.17 100,000 26,711 0.000605 120 SAN Cache to Disk 200.35 100,000 26,711 0.007500 1500 -B to Disk 211.52 100,000 26,711 0.007919 1585 (Approximately 4 records per read op in non B cases.)
-spin All new computers: servers, desktops, laptops; even phones and watches are now multi-core. Do NOT use the old X * # of CPUs rule to set spin. It is bogus. Bigger is not always better with spin! Modest values (5,000 to 10,000) generally provide the best and most consistent results for the vast majority of people. Use readprobe.p to explore. Check out Rich Banville s Superb Exchange 2008 Presentation!
-lruskips 100 It is simple and effective. Eliminates a lot of pointless internal housekeeping. Big benefit for busy systems! No negative impact on quiet systems. Makes the impact of bad code slightly less awful. Go ahead and set lruskips2 100 while you re at it.
Set *rangesize The default value of 50 is useless. Without the full set of tables enabled for monitoring many diagnostic techniques cannot be used. You need to restart the db to change these so do it proactively: Not when you already have a problem. Round up a bit to avoid needing to adjust with every schema change. Keep an eye on your coverage! Don t get out of sync. ProTop will generate a suggested .pf file for you
Otherargs The most important property in conmgr.properties Use for parameters that are not supported by exploder. Also allows you to point to a .pf file and maybe even avoid having to use OpenEdge Explorer at all!
Implement -bithold The bi file should not be allowed to grow beyond approximately 1/4th the free space of the filesystem holding it. That is because crash recovery may require 2x to 3x the size of the bi file to complete and requesting extra disk space at that point in time is generally not possible. If you have never had a problem with excess bi growth, this is a way to ensure that you never do. -bithold 500 If you decide to implement bistall or aistall you need good documentation! You will not be present when it happens. And even if you are you might not remember how to recognize a stall or how to address it.
bi cluster size The idea is to reduce the number and frequency of checkpoints giving APWs plenty of time to work. Larger bi clusters permit spikes in the workload to take place without ambushing the APWs. Easy to overlook when building new db via prostrct create 512 is the default OE 10 bi cluster size. 8192 is reasonable for small systems. 16384 is a good start for larger systems. Longer REDO phase on startup so don t get crazy. NOTa good idea for Workgroup database licenses. For WG small values (512 or 1024) are better.
bi cluster size $ grep (4250) dbname.lg (4250)Before-Image Cluster Size: 524288. ( = 512k ) The value above is the oe10 default value of 512k so let s make it larger: $ proutil dbname -C truncate bi -bi 16384 (1620) Before-image cluster size set to 16384 kb. (1621)Before-Image Cluster Size: 16777216. ( = 16384k ) $ proutil dbname -C -bigrow 8
Miscellaneous proutil (and rfutil) $ proutil dbName -C truncate bi -biblocksize 16 $ rfutil dbName -C aimage truncate -aiblocksize 16 $ proutil dbName -C enablelargefiles $ proutil dbName -C enablelargekeys $ proutil dbName -C updateschema $ proutil dbName -C updatevst $ proutil dbName -C enableb2 Schema Area $ proutil dbName -C -bigrow 8
PROBKUP The approved way to backup an OpenEdge database. PROBKUP knows where all parts of the database are. PROBKUP can be run online. Always use com and Bp 10 probkup online dbName dbName.pbk com Bp 10
Backups That Will Get You Fired Virtual Machine Snapshots SAN Snapshots 3rd Party Backup Tools OS Level Copy Commands Untested Scripts Deleting old backups before you have a new backup
Backup Caveats 3rd Party tools need to: First use probkup to disk Or shutdown db Or properly script a quiet point MUST wait for confirmation in the .lg file, return of proquiet is NOT sufficient MUST backup ALL files (it is easy to miss some, especially if they are added later) If you are on Windows and using Task Scheduler: Do NOT use a real user (or Administrator) Use a userid that NEVER LOGS IN Use a userid that does not have an expiring password Windows does not like to overwrite old backups
Use After-Imaging The Key to a robust recovery strategy. Similar to other database s REDO LOG . ROLL FORWARD RECOVERY: Restore a backup even a very old backup. Roll forward archived after-image logs. Until you have recovered to a point in time or a specific transaction. Protects your database from: Hardware errors Human errors (much more common) Malfeasance of all sorts
More About After-Imaging The DBA s Best Friend. Easy to implement, easy to manage. Running a database without after-imaging is grossly irresponsible. Without after-imaging your data, and the business that depends on that data, is at risk! After-imaging prevents DBA self-unemployment!
Periodically TEST your recovery procedures Untested recovery procedures WILL fail
APW, AIW, BIW & WDOG Always start a BIW Always start an AIW Start WDOG One or Two APWs are usually enough: Do NOTfollow the old 1 APW per disk suggestion. Too many is just a (small) waste of CPU cycles. If you are consistently flushing buffers at checkpoints increase bi cluster size and add an APW (one at a time until buffer flushes stop).
The Care and Feeding of SQL Many 3rd party tools require SQL SQL is very different from OpenEdge SQL is often not configured or is poorly configured The default SQL DBA user is sysprogress
SQLEXP It Is Always Available proenv> sqlexp -user sysprogress -password sysprogress -db sports2000 -H localhost -S 21012 OpenEdge Release 11.7 as of Mon Mar 27 10:21:54 EDT 2017 Connecting user "sysprogress" to URL "jdbc:datadirect:openedge://localhost:21012;databaseName=sports2000" SQLExplorer> select count(*) from customer; SQLExplorer> select count(*) from pub.customer; count(*) -------------------- 201120 SQLExplorer> quit A simple way to verify SQL issues without depending on external software!
DBTOOL and SQL Width proenv> dbtool sports2000 DATABASE TOOLS MENU - 11.7 --------------------------- 1. SQL Width & Date Scan w/Report Option 2. SQL Width Scan w/Fix Option . . . Q. Quit Choice: 2 The option will process all records including template records in the specified range. <connect>: (0=single-user 1=self-service >1=#threads)? 1 Padding % above current max: 25 <table>: (Table number or all)? all <area>: (Area number or all)? all <display>: (verbose level 0-4)? Total records read: 3561171 SQLWidth errors found: 7, Date errors found: 0 SQLWidth errors fixed: 7
OE 11.4+ Autonomous SQL Width Updates -SQLTruncateTooLarge ON|ALL|OFF|OUTPUT -SQLWidthUpdate ON|OFF Truncation is tricky if you use ON or ALL the data is truncated when evaluating the WHERE clause which can unexpectedly impact your result set. OUTPUT only impacts the data that is returned to the client.
Update Statistics SQL-92 uses a cost based optimizer But it cannot optimize without knowledge of the cost! (data distribution). Monthly or quarterly update statistics is appropriate for most people. Or when 20% of your data has changed. This is a data intense process: Run it during off hours if you can You might want to only do a few tables/indexes at a time
UPDATE STATISTICS /* genUpdateSQL.p * * mpro dbName p genUpdateSQL.p -param updstats.sql" * * sqlexp -user user -password passWord -db dbName -S port -infile updstats.sql outfile updstats.log */ output to value( session:parameter ). for each _file no-lock where _hidden = no: put unformatted "UPDATE TABLE STATISTICS AND INDEX STATISTICS AND ALL COLUMN STATISTICS FOR PUB." '"' _file._file-name '"' ";" skip "commit work; skip. end. output close.
Index Compact Compacts Indexes. Removes deleted record placeholders. Improves utilization = fewer levels & blocks and more index entries per read. Runs online or offline. Available since version 9.
Index Compact proutil dbname C idxcompact table.index target% Do NOT set target % for 100! Consider compacting when utilization < 70% and blocks > 1,000. INDEX BLOCK SUMMARY FOR AREA "APP_FLAGS_Idx" : 96 ------------------------------------------------------- Table Index Fields Levels Blocks Size %Util Factor PUB.APP_FLAGS AppNo 183 1 3 4764 37.1M 89.9 1.2 FaxDateTime 184 2 2 45 259.8K 72.4 1.6 FaxUserNotified 185 2 2 86 450.1K 65.6 1.7
Minimize Network Traffic Use a secondary broker to isolate high activity clients (such as reports). Use ServerType SQL or 4GL. Do NOT use BOTH . Set Mm to 8192 or larger. Use Mn and Ma to keep the number of clients per server low on old pre OE12 systems without multi-threaded servers. Use Mi 1 to spread 4GL connections across servers.
Minimize Network Traffic -prefetchDelay -prefetchFactor 100 -prefetchNumRecs 1000
Minimize Network Traffic Use FIELDS list in queries. NO-LOCK queries pack multiple records into a request. Watch out for client-side sorting and selection on queries. Remember that CAN-DO is evaluated on the CLIENT (yet another reason not to use it). Use -noautoresultlist/FORWARD-ONLY for dynamic queries.
Impact of Message Size & Prefetch Options for each _index fields(_field-name) no-lock: end. totMsgs qryRecv recSent recs/qry etime net time Description... 198 97 1758 18 10 208 -Mm 1024 208 102 1758 17 14 222 -Mm 4096 192 94 1758 19 9 201 -Mm 8192 180 88 1758 20 11 191 -Mm 16384 162 79 1758 22 14 176 -Mm 32600 152 74 1758 24 8 160 -prefetchDelay 154 75 1758 23 12 166 -prefetchDelay -prefetchFactor 100 8 2 1758 879 22 30 -prefetchDelay -prefetchFactor 100 -prefetchNumRecs 10000
Impact of Message Size & PrefetchNumRecs -prefetchNumRecs dominates! totMsgs qryRecv recSent recs/qry etime net time Description... 146 71 1758 25 13 159 -prefetchDelay -prefetchFactor 100 102 49 1758 36 8 110 -Mm 1024 -prefetchNumRecs 10000 28 12 1758 147 9 37 -Mm 4096 -prefetchNumRecs 10000 16 10 8 8 8 6 1758 293 13 29 -Mm 8192 -prefetchNumRecs 10000 3 1758 586 9 19 -Mm 16384 -prefetchNumRecs 10000 2 1758 879 23 31 -Mm 32600 -prefetchNumRecs 10000 2 1758 879 22 30 -prefetchDelay -prefetchNumRecs 10000 2 1758 879 22 30 -prefetchDelay -prefetchFactor 100 -prefetchNumRecs 10000
Manage Temp File IO Temp-file IO can exceed db IO. Sometimes by 2:1, 3:1 or more! -T isolates temp file IO. -t helps you to crudely diagnose the source of IO. -y provides some detail regarding r-code swapping. -mmax buffers r-code, 4096 is a good start for ChUI, 16384 for GUI. Memory mapped procedure libraries cache r-code. Use Bt & -tmpbsize to tune 4GL temp-tables.
Manage Temp File IO -rw-r--r-- 1 VEILLELA users 579312 Oct 19 15:16 srtrAyhEb -rw-r--r-- 1 wrightb users 35697664 Oct 19 15:16 srtH6miqb -rw-r--r-- 1 STEELEJL users 36772864 Oct 19 15:16 srtz37kyb -rw-r--r-- 1 THERRIKS users 0 Oct 19 07:12 srt--Elab -rw-r--r-- 1 root users 17649 Oct 19 15:16 lbiV6Qp7a -rw-r--r-- 1 root users 34704 Oct 19 15:16 lbi-TymMa -rw-r--r-- 1 wrightb users 811008 Oct 19 15:16 DBIHDmiqc -rw-r--r-- 1 BECKERLM users 8192 Oct 19 11:06 DBI--Abac -rw-r--r-- 1 CALUBACJ users 8192 Oct 19 09:16 DBI--Abyc CLIENT.MON (-y) Program access statistics: Times Bytes Reads from temp file: 0 0 Writes to temp file: 0 0 Loads of .r programs: 14 524594 Saves of compilation .r's: 0 0 Compilations of .p's: 0 0 Checks of files with stat: 165 0
Monitor Familiarize yourself with baseline performance so that you will recognize exceptions when they occur. Collect historical statistics to facilitate both forward planning (trending) and forensic performance analysis. Implement availability and performance monitoring systems so that issues are identified and resolved before they cause outages.
Rapid Readers Similar to a runaway consumes a whole CPU But is actually doing db logical IO Usually caused by: Table scans Poor index selection Unmonitored batch processes and app-servers Really bad algorithm choices
Rapid Readers Direct Auto Sampling JSON 15255 4576 0.227 ProTop Version 3.3h 2015/09/27 18:49:53 dbappraise 28 0 /db/dbappraise dbappraise Hit% 99.06 Commits: 0 New RM: 0 Oldest TRX: 00:00:00 Connections: 10 Log Reads: 194,472 Undos: 0 From RM: 0 Curr BIClstr: 0 Brokers: 1 OS Reads: 1,835 Lock Tbl HWM: 48 From Free: 0 Oldest BIClstr: 0 4gl Servers: 0 Rec Reads: 95,269 Curr # Locks: 0 Examined: 0 Checkpoints: 1,139 SQL Servers: 0 LogRd/RecRd: 2.04 Modified Bufs: -16 Front2Bk: 0 Curr AI Extent: Disabled 4gl Clients: 6 Log Writes: 0 IO Response: 3.33 Remove Lk: 0 Curr AI Seq#: 0 SQL Clients: 0 OS Writes: 0 BogoMIPS: 0.00 Empty AI Exts: -1 App Server: 0 Rec Creates: 0 BogoMIP%: 0.00 Full AI Exts: -1 BIW: 1 Rec Updates: 0 AIW: 0 Rec Deletes: 0 Notes: 0 0 APW Writes: 0 APWs: 2 Rec Locks: 10 BIW/AIW Write% 0 0 APW Write% 0 WDOG: 0 Rec Waits: 0 Writes to Log: 0 0 Bufs Scanned: 0 Local: 2 Idx Blk Spl: 0 BIW/AIW Writes: 0 0 APW Scan Wrts: 0 Remote: 0 Resrc Waits: 0 Partial Buf Wr: 0 0 APW Q Wrts: 0 Batch: 4 Latch Waits: 2 Busy Buf Waits: 0 0 Chkpt Q Wrts: 0 TRX: 0 Empty Buf Wts: 0 0 Flushed Bufs: 0 Blocked: 0 Table Activity Tbl# Area# Table Name #Records Turns Create Read v Update Delete OS Read > 8 22 activity 0.00 0 57,351 0 0 1,731 6 10 site 0.00 0 37,874 0 0 User IO Activity Usr# Name PID Flags Blk Ac v OS Rd OS Wr > 16 tom 14505 S4B 194216 1826 0 99.06% 0 0 34 ./test/churn.p 12 tom 22668 S4 62 0 0 100.00% 6 0 630 lib/vstlib.p 0 Hit% Rec Lck Rec Wts Line# Program Name
proGetStack - Client Stack Trace proenv> proGetStack 1576 proenv> type \protop\s2k_demo\protrace.1576 ===================================================== PROGRESS stack trace as of Fri Mar 1 15:46:49 2019 ===================================================== Startup parameters: -pf P:\oe117\startup.pf,-cpinternal ISO8859-1,-cpstream ISO8859-1 . . . (end .pf),-b,-db d:\bigsports\sports2000,-rand 2,-p updorder.p ** ABL Stack Trace ** --> updSalesRep updorder.p at line 67 (.\updorder.p) updorder.p at line 29 (.\updorder.p) ** Persistent procedures/Classes ** ** PROPATH ** .,P:\oe117\tty,P:\oe117\tty\adecomm.pl,P:\oe117\tty\adecomp.pl,P:\Progress\oe117\tty\prodict.pl,P:\Progress\oe117,P:\Progress\oe117\bin ** Databases (logical/type/physical) ** sports2000 PROGRESS d:\bigsports\sports2000 ** End of Protrace **
Parallelize Many legacy processes were designed when the system was much smaller or when multiple CPUs were unusual. Step outside of the single-threaded box and consider what portions of your system could benefit from being parallelized: MRP Runs Nightly Processing Reports Data Extracts Data Imports
Parallelize $ mbpro dbname p exp.p param 01|0,3000 $ mbpro dbname p exp.p param 02|3000,6000 $ mbpro dbname p exp.p param 03|6000,9999 /* exp.p */ define variable startCust as integer no-undo. define variable endCust as integer no-undo. startCust = integer( entry( 1, entry( 2, session:parameter, | ))). endCust = integer( entry( 2, entry( 2, session:parameter, | ))). output to value( export. + entry( 1, session:parameter, | ). for each customer no-lock where custNum >= startCust and custNum < endCust: export customer. end. output close. quit.
Larger db Blocks Larger blocks result in much more efficient IO. Fewer IO ops mean less contention for disk. Moving from 1k to 4k is huge. 4k to 8k is relatively less huge but still valuable. 8k works best in most cases. Especially read-heavy workloads. Better disk space efficiency (tighter packing, less overhead). Don t forget to adjust B and Rows Per Block!
Larger db Blocks Large Blocks reduce IO, fewer operations are needed to move the same amount of data. More data can be packed into the same space because there is proportionally less overhead. Because a large block can contain more data it has improved odds of being a cache hit . Large blocks enable HW features to be leveraged. Especially SAN HW.


")