Best Practices for Implementing a Paradata Warehouse Presentation
This presentation at the Washington Statistical Society Mini-Conference discusses best practices for implementing a Paradata Warehouse. It covers the benefits, system features, architecture, and how it improves access to paradata from different sources. The presentation also highlights cost and production reports, interactive dashboards, and metadata repositories that enhance data collection and analysis processes.
Download Presentation

Please find below an Image/Link to download the presentation.
The content on the website is provided AS IS for your information and personal use only. It may not be sold, licensed, or shared on other websites without obtaining consent from the author.If you encounter any issues during the download, it is possible that the publisher has removed the file from their server.
You are allowed to download the files provided on this website for personal or commercial use, subject to the condition that they are used lawfully. All files are the property of their respective owners.
The content on the website is provided AS IS for your information and personal use only. It may not be sold, licensed, or shared on other websites without obtaining consent from the author.
E N D
Presentation Transcript
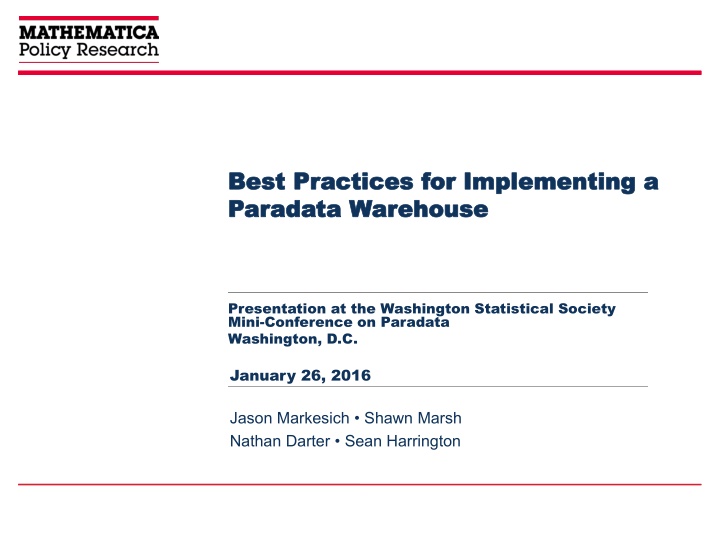
Best Practices for Implementing a Best Practices for Implementing a Paradata Paradata Warehouse Warehouse Presentation at the Washington Statistical Society Mini-Conference on Paradata Washington, D.C. January 26, 2016 Jason Markesich Shawn Marsh Nathan Darter Sean Harrington
Introduction Our Paradata Warehouse tracks hundreds of variables associated with each survey sample. By analyzing these paradata, we can tailor and modify data collection in real time, as new information is learned, to improve effectiveness and efficiency. Mathematica recently launched the Paradata Warehouse, a single, centralized data repository flexible enough to use on a single project or across multiple projects. 2
Presentation Roadmap Presentation Roadmap Overview of the Paradata Warehouse Benefits System features Architecture Report examples Ensuring data quality through standardization Testing and validation processes Data visualization tools and design principals Suggestions for promoting user adoption Final thoughts and lessons learned 3
Benefits of the Paradata Warehouse Improves access to paradata from many different data sources Can be used in tandem with advanced statistical techniques to monitor and improve data quality 4 1 Allows staff to manage with the data they want rather than the data they get Reduces programming costs associated with writing and supporting standard and ad- hoc reports outside of the warehouse 2 5 Facilitates decision-making that allow staff to make mid- course corrections within an adaptive design framework Enables cross-survey analysis to support design and budgeting decisions 3 6 4
System Features System Features Cost and production reports related to telephone interviewing, in-house locating, field locating/interviewing and data collection supervision Interactive dashboards that enable staff to drill down into paradata A metadata repository that collects information on survey characteristics 5
High High- -Level Paradata System Architecture Level Paradata System Architecture 6
Paradata Reports Current Paradata Reports are Used to Answer the Following Data Collection Questions Telephone Interviewing How productive are interviewers? How many hours are spent per complete? When are we most likely to reach respondents? What is the level of effort for completing cases? When should we stop calling cases? Appointments and Refusals How successful are we converting refusals? How many calls are we making per refusal case? Are we meeting our firm appointments? What is the outcome of scheduling appointments? 7
Paradata Reports (cont) Paradata Reports (cont) Current Paradata Reports are Used to Answer the Following Data Collection Questions In-House Locating How productive are locators? How many hours are spent on a locating case? What percentage of the sample did we locate? Field Data Collection How productive are field staff? How many hours are spent per complete? What is the level of effort to locate respondents in the field? How are field expenses impacting the budget? Data Collection Costs What is the overall cost per complete? How does the cost per complete change over time? Are specific modes driving costs? 8
Paradata Report Example Paradata Report Example 9
Ensuring Data Quality Through Standardization and Testing 10
Status and Charge Codes Status and Charge Codes A well-thought out and well-executed status code system is critical to ensuring that the cost and production indicators are valid, and to conduct meaningful cross- survey analysis Accurate reporting of cost information requires that project charge codes are set up correctly 11
Metadata Management Metadata Management We created the Project and Instruments Characteristics Site (PICS), a one-stop portal for recording metadata that can be used to facilitate cross-survey analysis in the warehouse Examples of metadata collected: Sponsoring agency Survey population Mode(s), language(s) and length of administration Study design and sample frame To ensure end-users metadata are standardized, we use a standard taxonomy for the metadata terms 12
Testing Processes Testing Processes Testing activities begin in the requirement-gathering phase and are carried out in an iterative manner Types of testing: Data completeness Data transformation Data quality Scalability and performance Regression tests Every component of the warehouse needs to be tested, both independently as well as when integrated. This includes testing the: ETL scripts The paradata warehouse itself Reporting scripts Front end / user interface 13
Data Visualization Tools Data Visualization Tools DV tools help engage users by providing answers faster and in an easy-to-understand format, and fosters creativity in their decision making Dashboards and graphical displays make it easier to spot trends and behavior patterns and simplifies the process for drilling into the data Useful for providing clients with a high-level summary of data collection production 15
Data Visualization Design Principals Data Visualization Design Principals Match DV capabilities to users roles/responsibilities, and level of interest Data collection supervisors vs. survey directors and statisticians Provide users with the ability to manipulate data without being dependent on programmers Choose the most basic visualization available that can effectively convey the intended message, and: Present information hierarchically Avoid visual clutter Use colors appropriately to maximize impact 16
Promoting User Adoption Promoting User Adoption Simplify processes and designs Engage users by providing updates throughout the development and implementation phases Develop a training program that s regular, on-going and easy-to-understand 17
Final Thoughts and Lessons Learned Final Thoughts and Lessons Learned Start small and build incrementally Provide flexibility to allow for significant changes in data warehousing functionality and integration of new data sources Some lessons learned: Get advice from data warehousing experts/consultants at the outset of the project Identify someone on the project team whose job is to focus exclusively on project management Identify project staff, not IT staff, who will be responsible for validating the paradata reports and indicators 18
For More Information Jason Markesich JMarkesich@mathematica-mpr.com Shawn Marsh SMarsh@mathematica-mpr.com Nathan Darter NDarter@mathematica-mpr.com Sean Harrington SHarrington@mathematica-mpr.com 19
