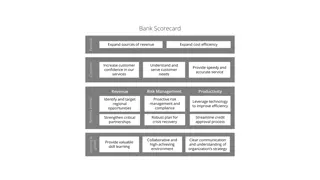
Balanced Scorecard in Corporate Economy
Balanced Scorecard, developed by Kaplan and Norton, evaluates firm performance in critical areas like finances, customers, processes, and learning/growth. It helps define mission, vision, strategy, and personal objectives to create value in organizations. The concept emphasizes satisfying shareholders, delighting customers, efficient processes, and a motivated workforce. It provides a strategic framework to drive continuous improvement and sustainability in the dynamic business environment.

Download Presentation

Please find below an Image/Link to download the presentation.
The content on the website is provided AS IS for your information and personal use only. It may not be sold, licensed, or shared on other websites without obtaining consent from the author.If you encounter any issues during the download, it is possible that the publisher has removed the file from their server.
You are allowed to download the files provided on this website for personal or commercial use, subject to the condition that they are used lawfully. All files are the property of their respective owners.
The content on the website is provided AS IS for your information and personal use only. It may not be sold, licensed, or shared on other websites without obtaining consent from the author.
E N D
Presentation Transcript
Balanced Scorecard Ing.J.Skorkovsk ,CSc. and various listed resources Department of Corporate Economy
Balanced Scorecard and continuum of value (1st part) Balanced Scorecard is a step in the continuum describing value and how the value is created Mission why we exist Values what is important to us Vision what we want to be Strategy our game plan Strategy map translate to strategy See next show Balanced scorecard measure and focus
Vysvtlivky k pedchozmu snmku MISE: Vyj d en toho, pro a k emu organizace existuje, co chce d lat, co um . Z kladn m posl n m ka d ho podniku je sv m z kazn k m poskytovat bu n jakou slu bu nebo jim prod vat nebo jinak poskytovat svojev robky Vize (anglicky Vision) je pojem, kter se pou v v r mci strategick ho zen . Vize je to p edstava douc ho budouc ho c lov ho stavu a m podobu jednoduch ho popisu jeho podoby a ide ln ho stavu, kter ho chce organizace svoj strategi dos hnout. Vize je sou st motiva n ch faktor (jedn se o nejv t motiv tor) v organizaci - pom h t hnout za jeden provaz sm rem k jej mu napln n . Kl ov je, aby se s viz ztoto nili v ichni mana e ia zam stnanci v organizaci. Stanoven vize je vhodn pro v echny typy a velikosti organizace. Bez n chyb jasn vyj d en sm r, kter m se chce organizace vydat a patn se tak stanovuj dal motiv tory. Metoda SMARTumo uj c dosahovat c le S - Specific specifick , konkr tn c le M - Measurable m iteln c le A - Achievable/Acceptable dosa iteln /p ijateln R - Realistic/Relevant realistick /relevantn (vzhledem ke zdroj m) T - Time Specific/Trackable asov specifick /sledovateln
Balanced Scorecard and continuum of value (2nd part) and how the value is created Balanced Scorecard is a step in the continuum describing value Target what WE need to do (plan, project, budget, ) Personal Objectives what I need to do Strategic Outcomes (v sledky, z v ry) Satisfied Shareholders Delighted Customers Efficient and Effective Processes Motivated and Prepared Workforce
Definition BS developed by Robert Kaplan and David Norton BS examines a firm s performance in four critical areas Finances how should we look to our shareholders ? Customers how should we look to our customer ? Processes at which business processes must we excel ? Learning and Growing how will we sustain our ability to change and improve ? Resource : Operation Management, Quality and Competitiveness in Global Environment, Russel &Taylor
Basic strategy map (two lower BS levels) SCM-Supply Chain Management Lower cost of transport Better way of replenishment Better delivery performance Production and Services Lower cost of production Continuous improvement (Kaizen) Reduced cycle time (see Little s law) Shorter production lead times Working capital efficiency (fin. leverage) MRP,MRP_II Advanced Planning and Scheduling Good Resource Planning Perfect way of cost calculation (actual- expected) Application of Theory of Constraints Supplier Relationship Lower cost of ownership JIT delivery TQM High quality supply Risk Management Financial risks Cash flow management Operational risk Technological risk Human capital Organizational Capital Information Capital Analytic applications BI, transaction processing applications=ERP, ..) Efficient and flexible structures and reporting system, teamwork, culture Excellent training of resources Resource : Operation Management, Quality and Competitiveness in Global Environment, Russel &Taylor (not the red ones)
Basic strategy map (two upper BS levels) Shareholder value Strategy Increase value of customer account Stars and Milk Caws segments of Boston Matrix Stable product portfolio New resources generation (higher market share ) R&D related to current product portfolio Finance Become industry cost leader (Gartner Magic Quadrant Matrix) Maximize use of existing assets Improve cost management Competitive prices Low cost of supply Perfect Quality Deliveries in time Processes at which business processes must we excel (see previous slide) ? Resource : Operation Management, Quality and Competitiveness in Global Environment, Russel &Taylor (not the red ones)
Balanced Scorcard worksheet (50+80)/2 Explanations : FTL-full truck load, LTL-less than truck load , SPC=statistical process control, EDI=electronic data interchange, Cycle time=time/unit=(e.g.7 min/1 customer request) Resource : Operation Management, Quality and Competitiveness in Global Environment, Russel &Taylor
Some units (home study) Will be presented later in sections such as : Little s law (WIP=Throughput *LT) Theory of Constraint Takt Time (TT) rhythm in which we have to produce in order to satisfy customer demand (demand is 240 toaster ovens and we can produce these in 480 minutes ->TT= 480/240=2 Lead Time (LT) Number of minutes, hours, or days that must be allowed for the completion of an operation or process, or must elapse before a desired action takes place see next slide
ERP outputs and BS Report generated from ERP MS Dynamics NAV Based on KPI estimation in % out analysed company is excellent, but on the other hand, collecting money, credit limit and overdue management is falling behind Resource : Operation Management, Quality and Competitiveness in Global Environment, Russel &Taylor (only radar chart)
BS and OM Finances how should we look to our shareholders ? Customers how should we look to our customer ? Processes at which business processes must we excel ? Learning and Growing how will we sustain our ability to change and improve ? Linear Business Intelligence Project management Total quality management Production Theory of constraints Product postitioning programming Decision making Pareto, ishikawa Boston Matrix Gartner QM Cutting, blending MRP-MRP- II,JIT,APS Drum buffer- rope Critical chain Workflow Kepner-Tregoe CONWIP Logistics Yield management Hurviwtz EOQ, ABC Prospect theory Little s law
Strategick iniciativy (doln dv BSC vrstvy maj zde definovan C l-M en -Z m r-Ak n program) Spokojen akcion i R st prodeje R st mar Ak n program C l Z m r M en Poskytnut hodnota Lep vztahy Udr et si z kazn ky Ak n prodeje Pom r WIN/LOST Pom r WIN/LOST Zv t it pod l na trhu Podpora image Obrat prodejn ho kan lu o 100 % - 2 roky (zv en ) Po et nov ch klient Po et probl m o 50 % - 2 roky (sn en ) Program c len ho marketingu Nep jemn p ekvapen P i li poprv Marketingov dovednosti % dovednost % z kazn k s OK daty Do 100% -rok Do 80 % -2 roky kolen Nov SW Marketingov dovednosti Z kaznick datab ze
Tabulka jako podklad pro konstrukci grafu JSS (FRTBSC) a eliminaci nepot ebn ch aktivit (obdoba postupu p i zav d j t hl v roby) JSELIT
Vsledn graf po aplikaci JSS (transpozice FRT->BSC vrstev)
Strategy Map-The Simple Model of Value Creation Strategy Financial perspective If we succeed, how will we look to our shareholders ? Customer perspective To achieve our vision, how must we look to our customers? Internal perspective To satisfy our customer, which processes must we excel at ? Learning and growth perspective To achieve our vision, how must our organization learn and improve ? Resource : Strategy Maps, Kaplan and Norton
Strategick mapa (BSC)- velmi zjednoduen schma Spokojen majitel Finance Vy tr n pod l Zisk Z kazn k V nosy Konkuren n v hoda Spokojen z kazn k Dod vka slu eb Procesy Zdroj kolen PZ Testy Vy kolen zdroj N klady R st n zk m ra sp nosti Parametry v b ru zdroje Vyhled v n zdroj profil zdroje m ra shody SZ a PZ Pot eba unik tn ch zdroj -znalost N klady na zdroje IQ kreativita flexibilita 18/11 TOC Workflow CONWIP
Test 1 What is the main goal of a company? A) Obtain the highest profit B) Find solutions that will be in the best interests of stakeholders C) Produce as many products as possible D) A and C E) None of the above
Test 2 Which of the following is Operations Management Technology not concerned with? A)Product & Service Technology B)Process Technology C) Globalization technology D)Information Technology E)All of the above
Test 3 Which of the following would be considered an input when converting inputs into outputs during the transformation process? A) Land B) Capital C) Raw Materials D) Facilities E) All of the above
Test 4 Which of the following is not a key element of supply chain management ? A)Purchasing B) Suppliers C) Location D) Logistics E) Managers decision

")

")

")

")

")


")


- velmi zjednodušené schéma")