Analyzing the Demand for College Professors Based on Demographic Trends
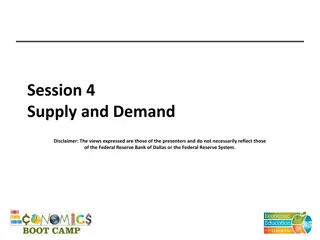
Exploring the demand for college professors utilizing data on high school and college enrollments, faculty employment, and salaries. The analysis involves modeling the demand for assistant professors and professors based on enrollment levels, prices, and budget constraints. Various data sets and diagrams are used to illustrate the trends in college demographics and faculty dynamics.

Download Presentation

Please find below an Image/Link to download the presentation.
The content on the website is provided AS IS for your information and personal use only. It may not be sold, licensed, or shared on other websites without obtaining consent from the author.If you encounter any issues during the download, it is possible that the publisher has removed the file from their server.
You are allowed to download the files provided on this website for personal or commercial use, subject to the condition that they are used lawfully. All files are the property of their respective owners.
The content on the website is provided AS IS for your information and personal use only. It may not be sold, licensed, or shared on other websites without obtaining consent from the author.
E N D
Presentation Transcript
Econ 709 Lecture on Demographics and the Demand for College Professors RDC 9-1-23
Some Data 1: Highschool and College Enrollments Highschool Graduates and College Enrollments 20,000 75.0 18,000 65.0 16,000 55.0 14,000 45.0 12,000 Thousands 10,000 35.0 8,000 25.0 6,000 15.0 4,000 5.0 2,000 0 -5.0 1970 1975 1980 1985 1990 1995 2000 2005 2010 2015 Year Recent Graduates (6 years) 4 Year College Enrollment 2-Year College Enrollment Percent Enrolled in College
Some Data 2: Faculty Employment F/PT Faculty Employed, Dept of Education Data 3,000,000 100.0 90.0 2,500,000 80.0 70.0 2,000,000 60.0 Number 1,500,000 50.0 40.0 1,000,000 30.0 20.0 500,000 10.0 0 0.0 1970 1975\1\ 1981 1986\1\ 1995\2\ 2005\2\ 2015\2\ 2020\2\ Year Full Time Faculty 4 Year Faculty 2 Year College Faculty Percent Full TIme
Some Data 3: Faculty Salaries (nominal) Average Faculty Salaries (all colleges, nominal) x $140,000 $120,000 $100,000 Dollars (nominal) $80,000 $60,000 $40,000 $20,000 $0 1970-71 1985-86 1992-93 1997-98 2003-04 2008-09 2013-14 2018-19 Axis Title Assistant Prof Salaries (nominal) Professor Salaries (nominal) Median Income (nominal)
Modeling the Demand for an Input (1) Initially, I thought that just discussion the data a bit would be sufficient for today s talk, but I thought that it would be useful to connect it up with your course work. To that, we need to return to the theory of the demand for inputs. At the firm level, firms choose the mix of output that maximize output for given costs. Suppose there are just two inputs assistant professors and professors, in that case C = wA + yP where w is the average assistant prof salary and Y is full professor salaries. Suppose that output is just Q =q(A, P) Note that one can use the cost function to solve for P as a function of A, namely P = (C-wA)/y
Modelling the Demand for an Input (2) Substituting that characterization of P into the production function produces Q= q(A, (C-wA)/y) Expressed in this form we are essentially checking output values along an iso cost line and finding the highest possible output for a given cost That quantity of assistant professors can be found by differentiating Q with respect to A and setting the result equal to zero assuming Q is strictly concave within this slice of the production function (which it would be if Q exhibits diminishing marginal returns) dQ/dA dq/DP (w/y) = 0 The implicit function theorem can be used to characterize A* as a function of output levels and input prices. A* = g(Q, w, y, C) This college s demand for assistant professors varies with its enrollment (Q), the prices paid for Assistant Prof and Full Profs, and its budget (C)
Modelling the demand for an Input (Note that this is the opposite of what you do to derive a cost function, where one would use the implicit function theorem to determine C, we would need the cost function to predict an individual college s enrollment, and then could get at the demand for faculty by substituting Q* into the relationship that we just characterized.) If there are N such colleges and the college of interest is the average one, then the overall demand for assistant professors would be NA* = Ng(Q, w, y, C) where Q now is the average enrollment. To estimate this relationship we have to decide on a plausible functional form for function g is it linear, exponential, or some combination of the two, etc?
BLS Projections (academic job market) Job Outlook Overall employment of postsecondary teachers is projected to grow 12 percent from 2021 to 2031, much faster than the average for all occupations About 132,600 openings for postsecondary teachers are projected each year, on average, over the decade. Many of those openings are expected to result from the need to replace workers who transfer to different occupations or exit the labor force, such as to retire. Employment Projected employment of postsecondary teachers varies by occupation (see table). Both part-time and full-time postsecondary teachers are included in these projections. The number of people attending postsecondary institutions is expected to grow over the projections decade. Students will continue to seek higher education to gain the knowledge and skills necessary to meet their career goals. As more people enter colleges and universities, more postsecondary teachers will be needed to serve these additional students. Colleges and universities are likely to hire more part-time teachers to meet this demand. In all disciplines, there is expected to be a limited number of full-time nontenure and full-time tenure positions. A growing number of older people, who are more likely than young people to need medical care, will create increased demand for healthcare. More postsecondary teachers are expected to be needed to help educate workers who provide healthcare services. However, despite expected increases in enrollment, employment growth in public colleges and universities will depend on state and local government budgets. If budgets for higher education are reduced, employment growth may be limited. Employment projections data for postsecondary teachers, 2021-31


")
")
")

")