Analyzing Statistics and Parameters
 undefined

Section 12.2: Statistics and Parameters


You analyzed data collection techniques.
•
Identify sample statistics and population
parameters.
•
Analyze data sets using statistics.


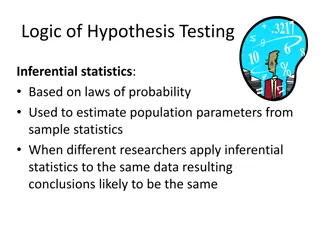
Statistical inference- when the statistics of a
sample are used to draw conclusion about the
entire population
Statistic- a measure that describes a
characteristic of a sample
Parameter- a measure that describes a
characteristic of a population (typically
estimated based on the statistics of a
carefully chosen random sample)
Statistics can and usually change from sample
to sample.
◦
Ex: The number of girls to boys in any given
classroom at McKinley
Parameters will not change.
◦
Ex: The number of girls to boys in McKinley
Statistics and Parameters
A
.
I
d
e
n
t
i
f
y
t
h
e
s
a
m
p
l
e
a
n
d
t
h
e
p
o
p
u
l
a
t
i
o
n
f
o
r
e
a
c
h
s
i
t
u
a
t
i
o
n
.
T
h
e
n
d
e
s
c
r
i
b
e
t
h
e
s
a
m
p
l
e
s
t
a
t
i
s
t
i
c
a
n
d
t
h
e
p
o
p
u
l
a
t
i
o
n
p
a
r
a
m
e
t
e
r
.
A
m
o
v
i
e
r
e
n
t
a
l
b
u
s
i
n
e
s
s
s
e
l
e
c
t
s
a
r
a
n
d
o
m
s
a
m
p
l
e
o
f
5
0
o
r
d
e
r
s
i
n
o
n
e
d
a
y
.
T
h
e
m
e
a
n
n
u
m
b
e
r
o
f
r
e
n
t
a
l
s
p
e
r
o
r
d
e
r
i
s
c
a
l
c
u
l
a
t
e
d
.
A
n
s
w
e
r
:
s
a
m
p
l
e
:
5
0
m
o
v
i
e
o
r
d
e
r
s
;
p
o
p
u
l
a
t
i
o
n
:
a
l
l
m
o
v
i
e
o
r
d
e
r
s
f
o
r
t
h
e
d
a
y
o
f
t
h
e
s
a
m
p
l
e
;
s
a
m
p
l
e
s
t
a
t
i
s
t
i
c
:
m
e
a
n
n
u
m
b
e
r
o
f
r
e
n
t
a
l
s
p
e
r
o
r
d
e
r
i
n
t
h
e
s
a
m
p
l
e
;
p
o
p
u
l
a
t
i
o
n
p
a
r
a
m
e
t
e
r
:
m
e
a
n
n
u
m
b
e
r
o
f
r
e
n
t
a
l
s
p
e
r
o
r
d
e
r
f
o
r
a
l
l
r
e
n
t
a
l
s
t
h
e
d
a
y
o
f
t
h
e
s
a
m
p
l
e
Statistics and Parameters
B
.
I
d
e
n
t
i
f
y
t
h
e
s
a
m
p
l
e
a
n
d
t
h
e
p
o
p
u
l
a
t
i
o
n
f
o
r
e
a
c
h
s
i
t
u
a
t
i
o
n
.
T
h
e
n
d
e
s
c
r
i
b
e
t
h
e
s
a
m
p
l
e
s
t
a
t
i
s
t
i
c
a
n
d
t
h
e
p
o
p
u
l
a
t
i
o
n
p
a
r
a
m
e
t
e
r
.
A
s
t
r
a
t
i
f
i
e
d
r
a
n
d
o
m
s
a
m
p
l
e
o
f
2
t
r
e
e
s
o
f
e
a
c
h
s
p
e
c
i
e
s
i
s
s
e
l
e
c
t
e
d
f
r
o
m
a
l
l
t
r
e
e
s
a
t
a
n
u
r
s
e
r
y
.
T
h
e
m
e
a
n
h
e
i
g
h
t
o
f
t
r
e
e
s
i
n
t
h
e
s
a
m
p
l
e
i
s
c
a
l
c
u
l
a
t
e
d
.
A
n
s
w
e
r
:
s
a
m
p
l
e
:
2
t
r
e
e
s
o
f
e
a
c
h
s
p
e
c
i
e
s
f
o
u
n
d
a
t
t
h
e
n
u
r
s
e
r
y
;
p
o
p
u
l
a
t
i
o
n
:
a
l
l
t
r
e
e
s
a
t
t
h
e
n
u
r
s
e
r
y
;
s
a
m
p
l
e
s
t
a
t
i
s
t
i
c
:
m
e
a
n
h
e
i
g
h
t
o
f
t
r
e
e
s
i
n
t
h
e
s
a
m
p
l
e
;
p
o
p
u
l
a
t
i
o
n
p
a
r
a
m
e
t
e
r
:
m
e
a
n
h
e
i
g
h
t
o
f
a
l
l
t
r
e
e
s
a
t
t
h
e
n
u
r
s
e
r
y
Means, Medians, and Modes are measures of
central tendency that represent data.
Measures of variation that assess the
variability of the data can also represent the
data.
◦
Examples: Range, Quartiles, Interquartile Range,
Mean Absolute Deviation, and Standard Deviation
(MAD) is the average of the absolute values of
the differences between the mean and each
value in the data set.
The ‘MAD’ is used to predict errors and judge
how well the mean represents the data.
Mean Absolute Deviation
P
E
T
S
A
r
e
s
c
u
e
a
g
e
n
c
y
r
e
c
o
r
d
s
t
h
e
n
u
m
b
e
r
o
f
p
e
t
s
a
d
o
p
t
e
d
e
a
c
h
m
o
n
t
h
:
{1
4
,
1
8
,
1
2
,
1
7
,
1
5
,
2
0
}
.
F
i
n
d
a
n
d
i
n
t
e
r
p
r
e
t
t
h
e
m
e
a
n
a
b
s
o
l
u
t
e
d
e
v
i
a
t
i
o
n
.
S
t
e
p
1
F
i
n
d
t
h
e
m
e
a
n
.
S
t
e
p
2
F
i
n
d
t
h
e
a
b
s
o
l
u
t
e
v
a
l
u
e
s
o
f
t
h
e
d
i
f
f
e
r
e
n
c
e
s
.
Mean Absolute Deviation
S
t
e
p
2
F
i
n
d
t
h
e
a
b
s
o
l
u
t
e
v
a
l
u
e
s
o
f
t
h
e
d
i
f
f
e
r
e
n
c
e
s
.
Mean Absolute Deviation
S
t
e
p
3
F
i
n
d
t
h
e
s
u
m
.
2 + 2 + 4 + 1 + 1 + 4 = 14
S
t
e
p
4
F
i
n
d
t
h
e
m
e
a
n
a
b
s
o
l
u
t
e
d
e
v
i
a
t
i
o
n
.
Formula for Mean
Absolute Deviation
The sum is 14 and
n
= 6.
Mean Absolute Deviation
A
n
s
w
e
r
:
A
m
e
a
n
a
b
s
o
l
u
t
e
d
e
v
i
a
t
i
o
n
o
f
2
.
3
i
n
d
i
c
a
t
e
s
t
h
a
t
,
o
n
a
v
e
r
a
g
e
,
t
h
e
m
o
n
t
h
l
y
n
u
m
b
e
r
o
f
p
e
t
s
a
d
o
p
t
e
d
e
a
c
h
m
o
n
t
h
i
s
a
b
o
u
t
2
.
3
p
e
t
s
f
r
o
m
t
h
e
m
e
a
n
o
f
1
6
p
e
t
s
.
Variance and Standard Deviation
S
C
O
R
E
S
L
e
o
t
r
a
c
k
e
d
h
i
s
h
o
m
e
w
o
r
k
s
c
o
r
e
s
f
o
r
t
h
e
p
a
s
t
w
e
e
k
:
{1
0
0
,
0
,
1
0
0
,
5
0
,
0
}
.
F
i
n
d
a
n
d
i
n
t
e
r
p
r
e
t
t
h
e
s
t
a
n
d
a
r
d
d
e
v
i
a
t
i
o
n
o
f
t
h
e
d
a
t
a
s
e
t
.
S
t
e
p
1
F
i
n
d
t
h
e
m
e
a
n
.
Variance and Standard Deviation
S
t
e
p
3
F
i
n
d
t
h
e
s
u
m
.
2500 + 2500 + 2500 + 0 + 2500 = 10,000
S
t
e
p
4
F
i
n
d
t
h
e
v
a
r
i
a
n
c
e
.
Variance and Standard Deviation
Formula for
Variance
The sum is
10,000 and
n
= 5.
S
t
e
p
5
F
i
n
d
t
h
e
s
t
a
n
d
a
r
d
d
e
v
i
a
t
i
o
n
.
A
n
s
w
e
r
:
A
s
t
a
n
d
a
r
d
d
e
v
i
a
t
i
o
n
v
e
r
y
c
l
o
s
e
t
o
t
h
e
m
e
a
n
s
u
g
g
e
s
t
s
t
h
a
t
t
h
e
d
a
t
a
d
e
v
i
a
t
e
q
u
i
t
e
a
b
i
t
.
M
o
s
t
o
f
L
e
o
’
s
s
c
o
r
e
s
a
r
e
f
a
r
a
w
a
y
f
r
o
m
t
h
e
m
e
a
n
o
f
5
0
.
Variance and Standard Deviation
Square Root of
the Variance
In this section on Statistics and Parameters, learn about statistical inference, sample statistics, population parameters, and measures of central tendency and variation. Understand how statistics are used to draw conclusions about populations and differentiate between sample statistics and population parameters. Explore real-life examples like movie rental orders and tree heights to grasp the concepts better. Dive into understanding means, medians, modes, and other variability measures to interpret data effectively.

Download Presentation

Please find below an Image/Link to download the presentation.
The content on the website is provided AS IS for your information and personal use only. It may not be sold, licensed, or shared on other websites without obtaining consent from the author.If you encounter any issues during the download, it is possible that the publisher has removed the file from their server.
You are allowed to download the files provided on this website for personal or commercial use, subject to the condition that they are used lawfully. All files are the property of their respective owners.
The content on the website is provided AS IS for your information and personal use only. It may not be sold, licensed, or shared on other websites without obtaining consent from the author.
E N D
Presentation Transcript
You analyzed data collection techniques. Identify sample statistics and population parameters. Analyze data sets using statistics.
Statistical inference- when the statistics of a sample are used to draw conclusion about the entire population Statistic- a measure that describes a characteristic of a sample Parameter- a measure that describes a characteristic of a population (typically estimated based on the statistics of a carefully chosen random sample)
Statistics can and usually change from sample to sample. Ex: The number of girls to boys in any given classroom at McKinley Parameters will not change. Ex: The number of girls to boys in McKinley
Statistics and Parameters Statistics and Parameters A. Identify the sample and the population for each situation. Then describe the sample statistic and the population parameter. A movie rental business selects a random sample of 50 orders in one day. The mean number of rentals per order is calculated. Answer: sample: 50 movie orders; population: all movie orders for the day of the sample; sample statistic: mean number of rentals per order in the sample; population parameter: mean number of rentals per order for all rentals the day of the sample
Statistics and Parameters Statistics and Parameters B. Identify the sample and the population for each situation. Then describe the sample statistic and the population parameter. A stratified random sample of 2 trees of each species is selected from all trees at a nursery. The mean height of trees in the sample is calculated. Answer: sample: 2 trees of each species found at the nursery; population: all trees at the nursery; sample statistic: mean height of trees in the sample; population parameter: mean height of all trees at the nursery
Means, Medians, and Modes are measures of central tendency that represent data. Measures of variation that assess the variability of the data can also represent the data. Examples: Range, Quartiles, Interquartile Range, Mean Absolute Deviation, and Standard Deviation
(MAD) is the average of the absolute values of the differences between the mean and each value in the data set. The MAD is used to predict errors and judge how well the mean represents the data.
Mean Absolute Deviation Mean Absolute Deviation PETSA rescue agency records the number of pets adopted each month: {14, 18, 12, 17, 15, 20}. Find and interpret the mean absolute deviation. Step 1 Find the mean. Step 2 Find the absolute values of the differences.
Mean Absolute Deviation Mean Absolute Deviation Step 2 Find the absolute values of the differences.
Mean Absolute Deviation Mean Absolute Deviation Step 3 Find the sum. 2 + 2 + 4 + 1 + 1 + 4 = 14 Step 4 Find the mean absolute deviation. Formula for Mean Absolute Deviation The sum is 14 and n = 6.
Mean Absolute Deviation Mean Absolute Deviation Answer: A mean absolute deviation of 2.3 indicates that, on average, the monthly number of pets adopted each month is about 2.3 pets from the mean of 16 pets.
In a set of data, the standard deviation shows how the data deviate from the mean. A low standard deviation indicates that the data tend to be very close to the mean, while a high standard deviation indicates that the data are spread out over a larger range of values. The standard deviation is represented by the lowercase Greek letter sigma, . The variance 2 of the data is the square of the standard deviation
Variance and Standard Deviation Variance and Standard Deviation SCORESLeo tracked his homework scores for the past week: {100, 0, 100, 50, 0}. Find and interpret the standard deviation of the data set. Step 1 Find the mean.
Variance and Standard Deviation Variance and Standard Deviation Step 2 Find the square of the differences, . (50 100)2 = 2500 (50 0)2 = 2500 (50 100)2 = 2500 (50 50)2 = 0 (50 0)2 = 2500 Step 3 Find the sum. 2500 + 2500 + 2500 + 0 + 2500 = 10,000
Variance and Standard Deviation Variance and Standard Deviation Step 4 Find the variance. Formula for Variance The sum is 10,000 and n = 5.
Variance and Standard Deviation Variance and Standard Deviation Step 5 Find the standard deviation. Square Root of the Variance Answer: A standard deviation very close to the mean suggests that the data deviate quite a bit. Most of Leo s scores are far away from the mean of 50.


 is the average of the absolute values of")
 is the average of the absolute values of")