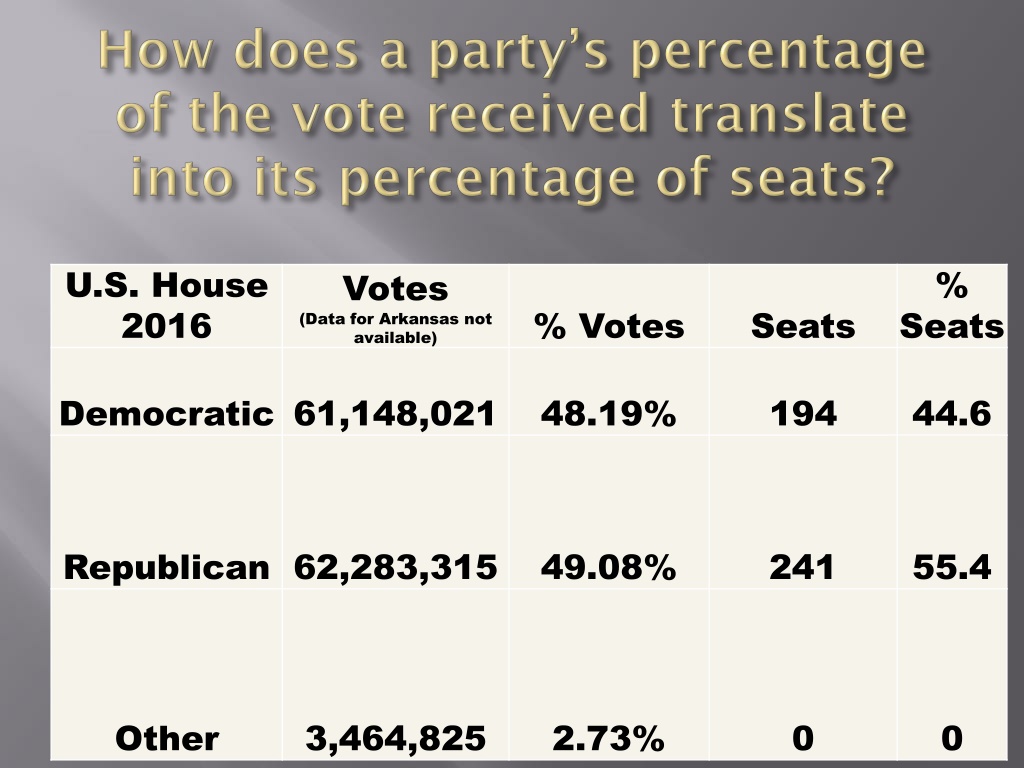
Analysis of U.S. House 2016 Election Results and District Efficiency
The analysis delves into the U.S. House 2016 election results, focusing on the distribution of votes between winning and losing candidates from different parties. It also examines the efficiency of the party vote distribution in districts, highlighting the impact on seat allocation based on the percentage of votes cast for winning candidates. Key findings include comparisons between Democrats and Republicans who won and lost, as well as the significance of party vote distribution in determining election outcomes.
Uploaded on Oct 09, 2024 | 0 Views
Download Presentation

Please find below an Image/Link to download the presentation.
The content on the website is provided AS IS for your information and personal use only. It may not be sold, licensed, or shared on other websites without obtaining consent from the author. Download presentation by click this link. If you encounter any issues during the download, it is possible that the publisher has removed the file from their server.
E N D
Presentation Transcript
U.S. House 2016 % Votes (Data for Arkansas not available) % Votes Seats Seats Democratic 61,148,021 48.19% 194 44.6 Republican 62,283,315 49.08% 241 55.4 Other 3,464,825 2.73% 0 0
What percentage of each partys vote in a state is cast for winning candidates? Democrats who won compared to Democrats who lost SC 2016: Clyburn (W) vs. Cherny, Bjorn, Cleveland, Fedalei, Person, Hyman (L) Republicans who won compared to Republicans who lost SC 2016: Sanford, Wilson, Duncan, Gowdy, Mulvaney, Rice (W) vs. Sterling (L) What percentage of the vote for winners in a state is cast for each party s candidates? Democrats who won compared to Republicans who won Clyburn vs. Sanford, Wilson, Duncan, Gowdy, Mulvaney, Rice Democrats who lost compared to Republicans who lost Cherny, Bjorn, Cleveland, Fedalei, Person, Hyman vs. Sterling
The greater the percentage of the party vote cast for candidates who win, the more efficiently the party vote is distributed (a sign of an effective partisan districting plan) The greater the percentage of the vote for winners cast for each party s candidates, the more seats the party wins even if it doesn t directly correlate with the raw vote cast for the party
District D R 77,288 174,066 195,571 88,951 200,945 222,116 168,041 160,695 194,537 190,826 190,319 63,317 210,495 Other Win D R R D R R D R R R R D R Win % 75.32% 55.72% 63.11% 74.47% 57.54% 60.96% 50.10% 53.16% 51.78% 56.99% 57.42% 79.63% 56.80% 1 2 3 4 5 6 7 8 9 254,644 128,973 114,314 259,534 148,252 142,267 168,695 137,139 171,503 144,023 141,107 247,591 160,115 6,134 9,358 0 0 0 0 0 4,446 9,650 10 11 12 13 0 0 0 0 Total 2,218,157 2,137,167 50.59% 29,588 9 R, 4 D 48.74%
District D 247,591 254,644 259,534 114,314 142,267 148,252 141,107 144,023 160,115 128,973 137,139 171,503 168,695 2,218,157 50.59% R 63,317 77,288 88,951 195,571 222,116 200,945 190,319 190,826 210,495 174,066 160,695 194,537 168,041 2,137,167 48.74% Other Win D D D R R R R R R R R R D Win % 79.63% 75.32% 74.47% 63.11% 60.96% 57.54% 57.42% 56.99% 56.80% 55.72% 53.16% 51.78% 50.10% 12 0 1 4 3 6 5 6,134 0 0 0 0 0 0 0 11 10 13 2 8 9 7 9,358 4,446 9,650 0 Total 29,588 9 R, 4 D


