Analysis of Traffic Speeds and Volumes in Parish Areas
Explore the trends in average and high traffic speeds, traffic volumes, and flow over time in various locations within the Parish. Discover insights on top speeds and traffic patterns, along with recommendations for monitoring and data compilation.

Download Presentation

Please find below an Image/Link to download the presentation.
The content on the website is provided AS IS for your information and personal use only. It may not be sold, licensed, or shared on other websites without obtaining consent from the author. If you encounter any issues during the download, it is possible that the publisher has removed the file from their server.
You are allowed to download the files provided on this website for personal or commercial use, subject to the condition that they are used lawfully. All files are the property of their respective owners.
The content on the website is provided AS IS for your information and personal use only. It may not be sold, licensed, or shared on other websites without obtaining consent from the author.
E N D
Presentation Transcript
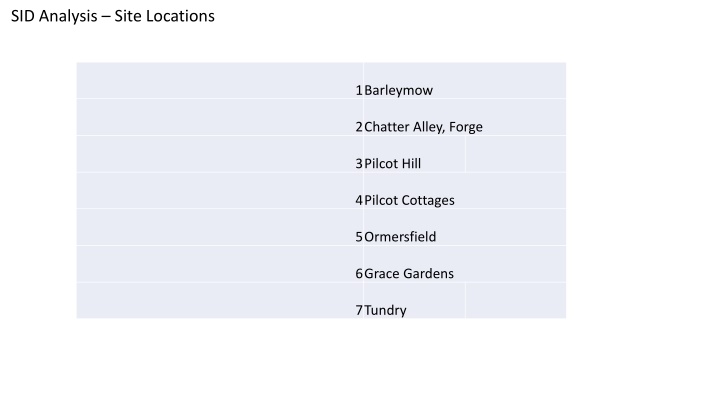
SID Analysis Site Locations 1Barleymow 2Chatter Alley, Forge 3Pilcot Hill 4Pilcot Cottages 5Ormersfield 6Grace Gardens 7Tundry
Average Speed By Site Over Time Highest average speeds by Ormersfield Average speeds are below speed limits across Parish Speeds look to be going up Average Speed 40.00 35.00 30.00 25.00 20.00 15.00 10.00 5.00 - 1 - H2 Mar 1 - H1 Apr 1 - H2 Aug 2 - H1 Feb 2 - H1 June 3 - H2 Feb 3 - H1 May 3 - H1 Aug 4 - H2 Jan 4 - H2 June 5 - H2 Apr 5 - H1 July 6 - H1 Mar 6 - H2 May 7 - H2 July Ingoing Outgoing
High Speed By Site Over Time Every site has high speeds well over limits Leaving village = higher speeds Highest speeds are trending down over time High Speeds By Location 100 90 80 70 60 50 40 30 20 10 0 1 - H2 Mar 1 - H1 Apr 1 - H2 Aug 2 - H1 Feb 2 - H1 June 3 - H2 Feb 3 - H1 May 3 - H1 Aug 4 - H2 Jan 4 - H2 June 5 - H2 Apr 5 - H1 July 6 - H1 Mar 6 - H2 May 7 - H2 July Ingoing Outgoing
Traffic Volume By Site Over Time Pilcot Hill & Pilcot Villages are biggest volumes centre of village Aug volumes materially down on Pilcot Hill, but up slightly up at Barleymow Volume of Traffic By Location 25000 20000 15000 10000 5000 0 1 - H2 Mar 1 - H1 Apr 1 - H2 Aug 2 - H1 Feb 2 - H1 June 3 - H2 Feb 3 - H1 May 3 - H1 Aug 4 - H2 Jan 4 - H2 June 5 - H2 Apr 5 - H1 July 6 - H1 Mar 6 - H2 May 7 - H2 July Ingoing Outgoing
Traffic Flow By Site Over Time Highest average volumes in Spring Otherwise pretty consistent across Parish Max vehicles per hour 180 160 140 120 100 80 60 40 20 0 1 - H2 Mar 1 - H1 Apr 1 - H2 Aug 2 - H1 Feb 2 - H1 June 3 - H2 Feb 3 - H1 May 3 - H1 Aug 4 - H2 Jan 4 - H2 June 5 - H2 Apr 5 - H1 July 6 - H1 Mar 6 - H2 May 7 - H2 July
Conclusions & Next Steps Biggest issue is top speeds An issue across the Parish Seem to be trending down after introduction SIDs; need to continue monitoring Doesn t seem to be that much reduction in traffic during school holidays Continue monitoring & compiling data Trial blind data collection after school holidays