Alternating Current and Voltage Waveforms

»
The voltage or current fluctuates according to a
certain pattern called a
waveform.
waveform.
»
An alternating voltage is one that
changes polarity
changes polarity
at
a certain rate
a certain rate
, and an alternating current is one
that
changes direction
changes direction
at a certain rate.
»
The sinusoidal waveform
sine wave
sine wave
is the
fundamental type of alternating current (ac) and
alternating voltage.
»
The
sine wave
sine wave
is a periodic type of waveform that
repeats at fixed intervals.
»
In addition, other types of repetitive
waveforms are composites of many
individual sine waves called harmonics.
The Sinusoidal voltages are produced by two types
of sources:
»
Rotating electrical machines
(Alternators)
(Ac generators)
»
Alternators are used in nearly all modern automobiles,
trucks, tractors, and other vehicles.
»
The signal generator is an instrument that
electronically produces
sine waves
for use in testing
or controlling electronic circuits and systems.
»
All signal generators consist of an
oscillator,
which is
an electronic circuit that produces
repetitive waves.
»
All generators
have controls
for adjusting the
amplitude and frequency.
»
It
It
is an instrument that produces more than one type of
waveform. It provides
pulse waveforms
pulse waveforms
as well as
sine
sine
waves
waves
and
and
triangular waves.
triangular waves.
»
An
arbitrary waveform generator
can be used to
generate
standard signals
like
sine waves
,
triangular
waves
, and
pulse
s
as well as signals with
various shapes
various shapes
and characteristics.
and characteristics.
»
The combined positive and negative alternations
make up
one
one
cycle
cycle
of a sine wave.
T
h
e
t
i
m
e
r
e
q
u
i
r
e
d
f
o
r
a
s
i
n
e
w
a
v
e
t
o
c
o
m
p
l
e
t
e
o
n
e
f
u
l
l
c
y
c
l
e
i
s
c
a
l
l
e
d
t
h
e
p
e
r
i
o
d
(
T
)
.
•
The period of a sine wave can be measured from a
zero
zero
crossing
crossing
to the
next corresponding zero
next corresponding zero
crossing,
crossing,
as indicated in Figure 4(a).
•
The period can also be measured from
any peak
in a given
cycle to the corresponding
peak in the next cycle
.
EXAMPLE 1
•
Show three possible ways to measure the period
of the sine wave in Figure 6. How many cycles are
shown?
Method 1:
The period can be measured from
one zero crossing to the corresponding zero
crossing in the next cycle (the slope must be
the same at the corresponding zero crossings).
Method 2:
The period can be measured from
the positive peak in one cycle to the positive
peak in the next cycle.
Method 3:
The period can be measured from
the negative peak in one cycle to the negative
peak in the next cycle.
»
Frequency (f ) is the number of cycles that a
sine wave completes in one second.
»
EXAMPLE 2
»
Which sine wave in Figure 9 has a higher
frequency? Determine the frequency and the
period of both waveforms.
F
I
G
U
R
E
9
»
In Figure 9(a),
three cycles
are completed in
1 s
;
therefore,
f
= 3 Hz
»
One cycle takes 0.333 s (one-third second), so the
period
is
T
= 0.333 s
F
I
G
U
R
E
9
»
In Figure 9(b),
five cycles
are completed in
1 s
;
therefore,
f
= 5 Hz
»
One cycle takes
0.2 s
(one-fifth second), so the
period is
T
= 0.2 s
F
I
G
U
R
E
9
»
Instantaneous Value
Figure 11 illustrates that at any point in time on a sine
wave, the voltage (or current) has
an
an
instantaneous
instantaneous
value
value
.
.
»
Instantaneous values
of voltage and current are
symbolized by lowercase
v
and
i
, respectively.
»
Peak Value:
The
peak value
of a sine wave is
the value of voltage (or current) at the positive or
the negative maximum (peak) with respect to
zero. also called the
amplitude
»
Peak-to-Peak Value :
The peak-to-peak value of a
sine wave, as shown in Figure 13, is the voltage or
current from the positive peak to the negative
peak. It is always twice the peak value as
»
RMS Value
referred to as the
effective value
,
of a sinusoidal voltage is actually a measure of
the heating effect of the sine wave.
»
Most
ac voltmeters
ac voltmeters
display
rms
voltage.
»
The
rms value
rms value
of a sinusoidal voltage is equal to
the
dc voltage
dc voltage
that produces the same amount of
heat in a resistance as does the sinusoidal voltage.
»
The peak value
of a sine wave can be
converted
to the corresponding
rms value
using the following relationships for either
voltage or current:
»
The average value
The average value
of a sine wave taken over one
complete cycle is always zero because the positive
values (above the zero crossing) offset the negative
values (below the zero crossing).
»
The average value
The average value
is the
total area
under the half-
cycle curve divided by the distance in radians of the
curve along the horizontal axis.
»
The result is derived in Appendix B
A
N
G
U
L
A
R
M
E
A
S
U
R
E
M
E
N
T
O
F
A
S
I
N
E
W
A
V
E
•
A sinusoidal voltage can be produced
by an
ac generator.
There is a
direct
relationship between the rotation of
the rotor
in an alternator and
the sine
wave output.
•
Thus,
the
angular
angular
measurement of the
rotor’s position is directly related to
the angle assigned to the sine wave
.
A
N
G
U
L
A
R
M
E
A
S
U
R
E
M
E
N
T
O
F
A
S
I
N
E
W
A
V
E
Angular Measurement:
A degree is an angular measurement
corresponding to 1/360
o
of a circle or
complete revolution.
A
N
G
U
L
A
R
M
E
A
S
U
R
E
M
E
N
T
O
F
A
S
I
N
E
W
A
V
E
Table 1
lists several values of degrees and
the corresponding radian values.
A
N
G
U
L
A
R
M
E
A
S
U
R
E
M
E
N
T
O
F
A
S
I
N
E
W
A
V
E
These angular measurements are illustrated
in Figure 17
.
A
N
G
U
L
A
R
M
E
A
S
U
R
E
M
E
N
T
O
F
A
S
I
N
E
W
A
V
E
R
a
d
i
a
n
/
D
e
g
r
e
e
C
o
n
v
e
r
s
i
o
n
Degrees can be converted to radians.
Degrees can be converted to radians.
R
R
a
a
d
d
i
i
a
a
n
n
s
s
c
c
a
a
n
n
b
b
e
e
c
c
o
o
n
n
v
v
e
e
r
r
t
t
e
e
d
d
t
t
o
o
d
d
e
e
g
g
r
r
e
e
e
e
s
s
.
.
P
h
a
s
e
o
f
a
S
i
n
e
W
a
v
e
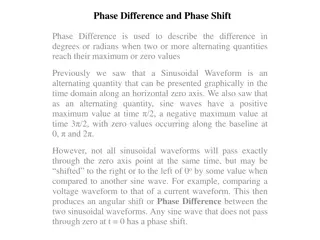
When the sine wave is shifted left or right with
respect to this reference, there is a phase shift.
Phase of a Sine Wave
T
h
e
S
i
n
e
W
a
v
e
F
o
r
m
u
l
a
T
h
e
s
i
n
e
w
a
v
e
a
m
p
l
i
t
u
d
e
(
A
)
i
s
t
h
e
m
m
a
a
x
x
i
i
m
m
u
u
m
m
v
a
l
u
e
o
f
t
h
e
v
o
l
t
a
g
e
o
r
c
u
r
r
e
n
t
o
n
t
h
e
v
e
r
t
i
c
a
l
a
x
i
s
;
a
n
g
u
l
a
r
v
a
l
u
e
s
r
u
n
a
l
o
n
g
t
h
e
h
o
r
i
z
o
n
t
a
l
a
x
i
s
.
T
h
e
v
a
r
i
a
b
l
e
y
i
s
a
n
i
i
n
n
s
s
t
t
a
a
n
n
t
t
a
a
n
n
e
e
o
o
u
u
s
s
v
a
l
u
e
t
h
a
t
r
e
p
r
e
s
e
n
t
s
e
i
t
h
e
r
v
o
l
t
a
g
e
o
r
c
u
r
r
e
n
t
a
t
a
g
i
v
e
n
a
n
g
l
e
ϴ
T
h
e
S
i
n
e
W
a
v
e
F
o
r
m
u
l
a
The instantaneous voltage at a point along
the horizontal axis as follows, where
y
=
v
and
A
=
V
p
E
x
p
r
e
s
s
i
o
n
s
f
o
r
P
h
a
s
e
-
S
h
i
f
t
e
d
S
i
n
e
W
a
v
e
s
When a sine wave is shifted to the right of the reference
(lagging)
by a certain angle
φ
, as in figure 26(a). The
general expression is
E
x
p
r
e
s
s
i
o
n
s
f
o
r
P
h
a
s
e
-
S
h
i
f
t
e
d
S
i
n
e
W
a
v
e
s
When a sine wave is shifted to the left of the reference
(leading
) by a certain angle,
φ
, as shown in Figure 26(b),
the general expression is
E
x
p
r
e
s
s
i
o
n
s
f
o
r
P
h
a
s
e
-
S
h
i
f
t
e
d
S
i
n
e
W
a
v
e
s
EXAMPLE
Determine the instantaneous value at the reference
point on the horizontal axis for each voltage sine
wave in Figure 27
E
x
p
r
e
s
s
i
o
n
s
f
o
r
P
h
a
s
e
-
S
h
i
f
t
e
d
S
i
n
e
W
a
v
e
s
T
h
e
l
e
n
g
t
h
o
f
t
h
e
p
h
a
s
o
r
i
s
t
h
e
p
e
a
k
v
a
l
u
e
o
f
t
h
e
s
i
n
u
s
o
i
d
a
l
v
o
l
t
a
g
e
V
p
,
T
h
u
s
,
t
h
e
o
p
p
o
s
i
t
e
s
i
d
e
o
f
t
h
e
t
r
i
a
n
g
l
e
,
w
h
i
c
h
i
s
t
h
e
i
n
s
t
a
n
t
a
n
e
o
u
s
v
a
l
u
e
,
c
a
n
b
e
e
x
p
r
e
s
s
e
d
a
s
E
X
A
M
P
L
E
:
F
o
r
t
h
e
P
h
a
s
o
r
i
n
e
a
c
h
p
a
r
t
o
f
F
i
g
u
r
e
3
2
,
d
e
t
e
r
m
i
n
e
t
h
e
i
n
s
t
a
n
t
a
n
e
o
u
s
v
o
l
t
a
g
e
v
a
l
u
e
.
T
h
e
l
e
n
g
t
h
o
f
e
a
c
h
r
e
p
r
e
s
e
n
t
s
t
h
e
p
e
a
k
v
a
l
u
e
o
f
t
h
e
s
i
n
u
s
o
i
d
a
l
v
o
l
t
a
g
e
.
.
(
A
)
v
=
(
1
0
V
)
s
i
n
0
°
=
(
1
0
V
)
(
0
)
=
0
V
(
B
)
v
=
(
1
0
V
)
s
i
n
3
0
°
=
(
1
0
V
)
(
0
.
5
)
=
5
V
(
C
)
v
=
(
1
0
V
)
s
i
n
9
0
°
=
(
1
0
V
)
(
1
)
=
1
0
V
v
=
(
1
0
V
)
s
i
n
2
7
0
°
=
(
1
0
V
)
(
-
1
)
=
-
1
0
V
v
=
(
1
0
V
)
s
i
n
3
3
0
°
=
(
1
0
V
)
(
-
0
.
5
)
=
-
5
V
v
=
(
1
0
V
)
s
i
n
1
3
5
°
=
(
1
0
V
)
(
0
.
7
0
7
)
=
7
.
0
7
V
•
A phasor diagram can be used to show the relative
relationship of two or more sine waves of the same
frequency.
Example:
Use a phasor diagram to represent the
sine waves in Figure 34.
Solution:
The phasor diagram representing the
sine waves is shown in Figure 35.
Since, one cycle of a sine wave is traced out when
a phasor is rotated through 360
0
or
2
π
radians in
a time equal to the period,
T
,
the angular velocity
the angular velocity
(distance/time) can be expressed as.
When a phasor is rotated at an angular velocity
then
t
is the
angle
angle
through which the phasor
has passed at any instant.
Therefore, the following relationship can be
stated:
When a time-varying ac voltage such as a sinusoidal
voltage is applied to a circuit,
Ohm’s law
,
Kirchhoff’s
laws
, and the
power formulas
apply to
ac
circuits in
the same way that they apply to
dc
circuits
.
P
o
w
e
r
i
n
r
e
s
i
s
t
i
v
e
a
c
c
i
r
c
u
i
t
s
i
s
d
e
t
e
r
m
i
n
e
d
t
h
e
s
a
m
e
a
s
f
o
r
d
c
c
i
r
c
u
i
t
s
e
x
c
e
p
t
t
h
a
t
y
o
u
m
u
s
t
u
s
e
r
m
s
v
a
l
u
e
s
o
f
c
u
r
r
e
n
t
a
n
d
v
o
l
t
a
g
e
.
Example:
Determine the
rms
voltage across each
resistor and the
rms
current in Figure 39. The source
voltage is given as an
rms
value. Also determine the
total power
.
•
Amplifier circuits are example of
ac signal
voltages superimposed on dc operating
voltages
.
•
This is a common application of the
superposition theorem.
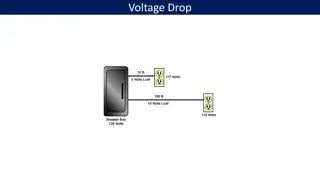
These two voltages will add algebraically to produce an ac
voltage “riding” on a dc level, as measured across the resistor
.
Example:
Determine the maximum and minimum
voltage across the resistor in each circuit of figure 43.
In Figure 43(a), the maximum voltage across
R
is
Vmax
=
V
DC
+
Vp
= 12 V + 10 V =
22 V
The minimum voltage across
R
is
Vmin
=
V
DC
-
Vp
= 12 V - 10 V =
2 V
Therefore,
V
R
(
tot
)
is an-alternating sine wave that varies from
+22 V
to
+2 V,
as shown in Figure 44(a).
In Figure 43(b), the maximum voltage across
R
is
Vmax
=
V
DC
+
Vp
= 6 V + 10 V =
16 V
The minimum voltage across
R
is
Vmin
=
V
DC
-
Vp
= -
4
V
Therefore,
V
R
(
tot
)
is an alternating sine wave that varies
from
+16 V
to
- 4 V
as shown in Figure 44(b).
Two major types of waveforms are the
pulse
waveform and the
triangular
waveform
.
•
In Figure 53, the pulses repeat at regular intervals.
The rate at which the pulses repeat is the
pulse
repetition frequency
, which is the fundamental
frequency of the waveform
.
f
= 1/
T
.
Square Waves :
A square wave is a pulse waveform with
a
duty cycle of 50%.
Thus, the pulse
width is equal to one-half of the period.
A square wave is shown in Figure 55
An important characteristic of repetitive pulse
waveforms is the
duty cycle.
duty cycle.
The duty cycle is the ratio of the pulse width
(
t
W
)
to
the period
(
T
)
and is usually expressed as a
percentage.
The Average Value of a Pulse Waveform:
The
average value
(
V
avg
)
of a pulse waveform is
equal to its baseline value plus its duty cycle
times its amplitude
.
Example :
Determine the average value of
each of the waveforms in Figure 56.
In Figure 56(a), the baseline is at 0 V, the amplitude
is 2 V, and the duty cycle is 10%. The average value
is
V(
avg)
= baseline + (duty cycle)(amplitude)
= 0 V + (0.1)(2 V) = 0.2 V
The waveform in Figure 56(b) has a baseline of
+1 V
,
an
amplitude of
5 V
and a duty cycle of
50%.
The average value
is
V(avg)
= baseline + (duty cycle)(amplitude)
= 1 V + (0.5)(5 V) = 1 V + 2.5 V = 3.5 V
Figure 56(c) shows a square wave with a baseline of
-1 V
and an amplitude of 2 V. The average value is
Vavg = baseline + (duty cycle)(amplitude)
= -1 V + (0.5)(2 V) = -1 V + 1 V = 0 V
This is an alternating square wave, and, as with an
alternating sine wave, it has an average of zero.
Triangular Waveforms:
The period of this waveform is measured from one peak to the
next corresponding peak, as illustrated. This particular triangular
waveform is alternating and has an average value of zero.
Figure 60 depicts a triangular waveform with a nonzero
average value. The frequency for triangular waves is
determined in the same way as for sine waves, that is,
f
= 1/
T
.
Harmonic:
The
fundamental frequency
is the repetition
rate of the waveform, and
the
harmonics
are higher
frequency sine waves that are multiples of the
fundamental. (See Ref.)
Alternating current and voltage exhibit specific waveform patterns such as sinusoidal waves. The sinusoidal waveform, including sine waves and harmonics, is fundamental in AC circuits. Sources like alternators produce sinusoidal voltages, while electronic signal generators create various waveforms for testing electronic systems. These instruments play a crucial role in manipulating and controlling electrical signals. Understanding the polarity and cycles of sine waves is essential in grasping the behavior of alternating current and voltage.

Download Presentation

Please find below an Image/Link to download the presentation.
The content on the website is provided AS IS for your information and personal use only. It may not be sold, licensed, or shared on other websites without obtaining consent from the author.If you encounter any issues during the download, it is possible that the publisher has removed the file from their server.
You are allowed to download the files provided on this website for personal or commercial use, subject to the condition that they are used lawfully. All files are the property of their respective owners.
The content on the website is provided AS IS for your information and personal use only. It may not be sold, licensed, or shared on other websites without obtaining consent from the author.
E N D
Presentation Transcript
ALTERNATING CURRENT AND VOLTAGE
THE SINUSOIDAL WAVEFORM The voltage or current fluctuates according to a certain pattern called a waveform. An alternating voltage is one that changes polarity at a certain rate, and an alternating current is one that changes direction at a certain rate.
THE SINUSOIDAL WAVEFORM The sinusoidal waveform sine wave is the fundamental type of alternating current (ac) and alternating voltage. The sine wave is a periodic type of waveform that repeats at fixed intervals.
THE SINUSOIDAL WAVEFORM In addition, other types of repetitive waveforms are composites of many individual sine waves called harmonics.
THE SINUSOIDAL WAVEFORM The Sinusoidal voltages are produced by two types of sources: Rotating electrical machines (Alternators) (Ac generators) Alternators are used in nearly all modern automobiles, trucks, tractors, and other vehicles.
Electronic Signal Generators The signal generator is an instrument that electronically produces sine waves for use in testing or controlling electronic circuits and systems. All signal generators consist of an oscillator, which is an electronic circuit that produces repetitive waves. All generators have controls for adjusting the amplitude and frequency.
Function generator It is an instrument that produces more than one type of waveform. It provides pulse waveforms as well as sine waves and triangular waves.
Electronic Signal Generators An arbitrary waveform generator can be used to generate standard signals like sine waves, triangular waves, and pulses as well as signals with various shapes and characteristics.
Polarity of a Sine Wave The combined positive and negative alternations make up one cycle of a sine wave.
Period of a Sine Wave The time required for a sine wave to complete one full cycle is called the period (T).
Period of a Sine Wave The period of a sine wave can be measured from a zero crossing to the next corresponding zero crossing, as indicated in Figure 4(a). The period can also be measured from any peak in a given cycle to the corresponding peak in the next cycle.
Period of a Sine Wave EXAMPLE 1 Show three possible ways to measure the period of the sine wave in Figure 6. How many cycles are shown?
Period of a Sine Wave Method 1: The period can be measured from one zero crossing to the corresponding zero crossing in the next cycle (the slope must be the same at the corresponding zero crossings).
Period of a Sine Wave Method 2: The period can be measured from the positive peak in one cycle to the positive peak in the next cycle.
Period of a Sine Wave Method 3: The period can be measured from the negative peak in one cycle to the negative peak in the next cycle.
Frequency of a Sine Wave Frequency (f ) is the number of cycles that a sine wave completes in one second.
Frequency of a Sine Wave EXAMPLE 2 Which sine wave in Figure 9 has a higher frequency? Determine the frequency and the period of both waveforms. FIGURE 9
Frequency of a Sine Wave In Figure 9(a), three cycles are completed in 1 s; therefore, f = 3 Hz One cycle takes 0.333 s (one-third second), so the period is T = 0.333 s FIGURE 9
Frequency of a Sine Wave In Figure 9(b), five cycles are completed in 1 s; therefore, f = 5 Hz One cycle takes 0.2 s (one-fifth second), so the period is T = 0.2 s FIGURE 9
SINUSOIDAL VOLTAGE AND CURRENT VALUES Instantaneous Value Figure 11 illustrates that at any point in time on a sine wave, the voltage (or current) has an instantaneous value.
SINUSOIDAL VOLTAGE AND CURRENT VALUES Instantaneous values of voltage and current are symbolized by lowercase v and i, respectively.
SINUSOIDAL VOLTAGE AND CURRENT VALUES Peak Value: The peak value of a sine wave is the value of voltage (or current) at the positive or the negative maximum (peak) with respect to zero. also called the amplitude
SINUSOIDAL VOLTAGE AND CURRENT VALUES Peak-to-Peak Value : The peak-to-peak value of a sine wave, as shown in Figure 13, is the voltage or current from the positive peak to the negative peak. It is always twice the peak value as
SINUSOIDAL VOLTAGE AND CURRENT VALUES RMS Value referred to as the effective value, of a sinusoidal voltage is actually a measure of the heating effect of the sine wave. Most ac voltmeters display rms voltage.
SINUSOIDAL VOLTAGE AND CURRENT VALUES The rms value of a sinusoidal voltage is equal to the dc voltage that produces the same amount of heat in a resistance as does the sinusoidal voltage.
SINUSOIDAL VOLTAGE AND CURRENT VALUES The peak value of a sine wave can be converted to the corresponding rms value using the following relationships for either voltage or current:
SINUSOIDAL VOLTAGE AND CURRENT VALUES The average value of a sine wave taken over one complete cycle is always zero because the positive values (above the zero crossing) offset the negative values (below the zero crossing). The average value is the total area under the half- cycle curve divided by the distance in radians of the curve along the horizontal axis. The result is derived in Appendix B
ANGULAR MEASUREMENT OF A SINE WAVE A sinusoidal voltage can be produced by an ac generator. There is a direct relationship between the rotation of the rotor in an alternator and the sine wave output. Thus, the angular measurement of the rotor s position is directly related to the angle assigned to the sine wave.
ANGULAR MEASUREMENT OF A SINE WAVE Angular Measurement: A degree is an angular measurement corresponding to 1/360oof a circle or complete revolution.
ANGULAR MEASUREMENT OF A SINE WAVE Table 1 lists several values of degrees and the corresponding radian values.
ANGULAR MEASUREMENT OF A SINE WAVE These angular measurements are illustrated in Figure 17.
ANGULAR MEASUREMENT OF A SINE WAVE Radian/Degree Conversion Degrees can be converted to radians. Radians can be converted to degrees.
Phase of a Sine Wave When the sine wave is shifted left or right with respect to this reference, there is a phase shift.
The Sine Wave Formula The sine wave amplitude (A) is the maximum value of the voltage or current on the vertical axis; angular values run along the horizontal axis. The variable y is an instantaneous value that represents either voltage or current at a given angle
The Sine Wave Formula The instantaneous voltage at a point along the horizontal axis as follows, where y = v and A = Vp
Expressions for Phase-Shifted Sine Waves When a sine wave is shifted to the right of the reference (lagging) by a certain angle , as in figure 26(a). The general expression is
Expressions for Phase-Shifted Sine Waves When a sine wave is shifted to the left of the reference (leading) by a certain angle, , as shown in Figure 26(b), the general expression is
Expressions for Phase-Shifted Sine Waves EXAMPLE Determine the instantaneous value at the reference point on the horizontal axis for each voltage sine wave in Figure 27
Phasor Representation of a Sine Wave The length of the phasor is the peak value of the sinusoidal voltage Vp, Thus, the opposite side of the triangle, which is the instantaneous value, can be expressed as
Phasor Representation of a Sine Wave EXAMPLE: For the Phasor in each part of Figure 32, determine the instantaneous voltage value. The length of each represents the peak value of the sinusoidal voltage..
Phasor Representation of a Sine Wave (A) v = (10 V)sin 0 = (10 V)(0) = 0 V (B)v = (10 V)sin 30 = (10 V)(0.5) = 5 V (C )v = (10 V)sin 90 = (10 V)(1) = 10 V
Phasor Representation of a Sine Wave v = (10 V)sin 135 = (10 V)(0.707) = 7.07 V v = (10 V)sin 270 = (10 V)(-1) = - 10 V v = (10 V)sin 330 = (10 V)(-0.5) = - 5 V
Phasor Diagrams A phasor diagram can be used to show the relative relationship of two or more sine waves of the same frequency.
Phasor Diagrams Example: Use a phasor diagram to represent the sine waves in Figure 34.
Phasor Diagrams Solution: The phasor diagram representing the sine waves is shown in Figure 35.
Angular Velocity of a Phasor Since, one cycle of a sine wave is traced out when a phasor is rotated through 3600or 2 radians in a time equal to the period, T, the angular velocity (distance/time) can be expressed as.
Angular Velocity of a Phasor When a phasor is rotated at an angular velocity then t is the angle through which the phasor has passed at any instant. Therefore, the following relationship can be stated: