Advancing Electric Bus Deployment at CTA: A Comprehensive Overview
Explore the evolution of the CTA's electric bus program, including current fleet statistics, future plans, route selection considerations, and a focus on the Navy Pier bus turn-around example. Delve into the comparison of e-buses in the fleet and key policy considerations shaping the transition towards sustainable public transportation.

Download Presentation

Please find below an Image/Link to download the presentation.
The content on the website is provided AS IS for your information and personal use only. It may not be sold, licensed, or shared on other websites without obtaining consent from the author. Download presentation by click this link. If you encounter any issues during the download, it is possible that the publisher has removed the file from their server.
E N D
Presentation Transcript
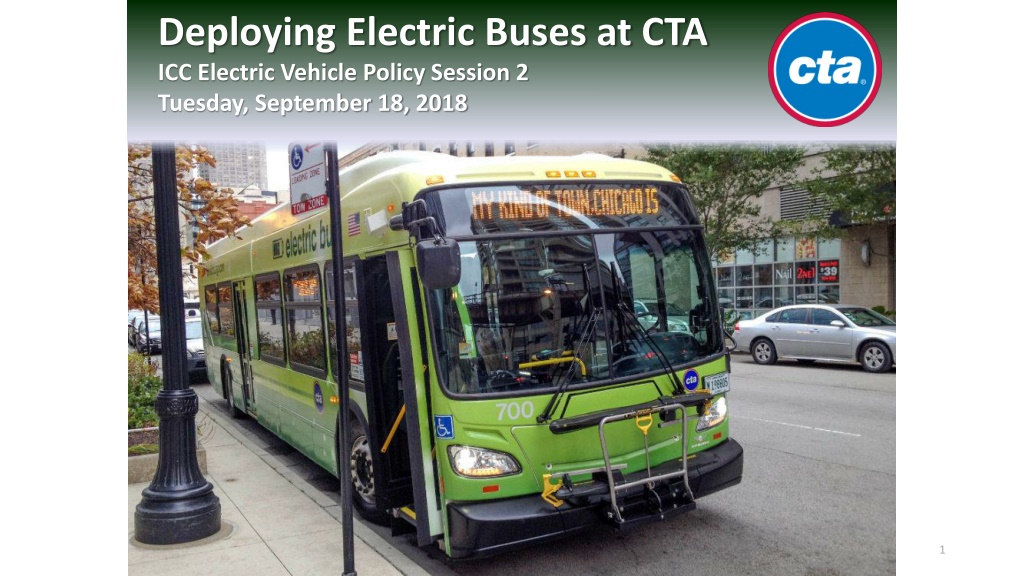
Deploying Electric Buses at CTA ICC Electric Vehicle Policy Session 2 Tuesday, September 18, 2018 1
Fun facts on CTAs bus system Fun facts on CTA s bus system CTA Bus Service Number of diesel buses 1,862 Number of electric buses 2 Bus routes served 129 Bus stops served 10,768 Daily bus miles traveled 161,192 Annual bus ridership 248.9 M Annual diesel consumption 16.8 M gal Annual diesel cost $33.4 M CTA bus garages 7 2
Evolution of CTAs electric bus program Evolution of CTA s electric bus program 2014 2015 2016 2017 2018 2019 2020 2021 RFP Delivery of pilot e-buses; install chargers 2 New Flyer e-buses enter service Planning begins for more e-buses TBD further scale-up of e-buses released for up to 45 e-buses + chargers Contract approved for 20 Proterra e-buses Delivery of remaining e-buses 3
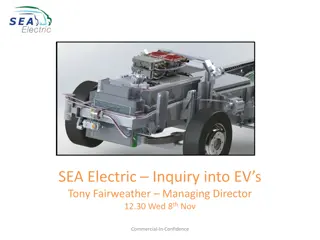
Comparison of e Comparison of e- -buses in CTA s fleet buses in CTA s fleet Phase 1 Phase 2 Manufacturer New Flyer Proterra Number purchased 2 20 Year entering service 2014 2019-2020 Charging location Bus garages ( depot charging ) Bus turn-arounds ( en-route charging ) Battery capacity 300 kWh 440 kWh Range 100 miles (run 80) >100 miles (run ??) Charger power 100 kW 450 kW ( fastcharge ) ( slow charge ) Service times AM & PM rush 24/7 Service routes Flexible Fixed: #66 & #124 4
Selection of routes and terminals Selection of routes and terminals for en for en- -route e route e- -bus charging bus charging Operational aspects of bus routes Physical aspects of bus turn-arounds Policy considerations Must be able to maintain reliable service with e-buses. Must align with policy priorities. Must accommodate the operation of e-buses and fast- chargers. Indoor bus garage Route length (time, miles) Layover time at terminals Bus accumulation at terminals Scalability for e-buses Visibility Equity Environmental justice Tourism Education Ability to do CTA construction Available space Layout Lane/bay configuration Bypass lanes 5
Current example: Current example: Navy Pier bus turn Navy Pier bus turn- -around around 6
Considerations for e Considerations for e- -bus scale bus scale- -up up What is the right mix of depot charging vs. en-route charging? Range requirements for routes Capacity requirements for garages Trade-offs in the efficiency of e-buses (miles per kWh) Differential in charger construction/installation costs How can CTA install and operate charging infrastructure most cost-effectively? Strategic planning/design of en-route charging infrastructure Coordination with ComEd Minimize demand fees by managing charging times Consider distributed energy resources to power chargers 7
Contact Info: Kate Tomford ktomford@transitchicago.com (312) 681-3487 8