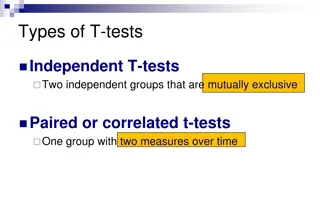
2-Sample T-Tests: Application and Interpretation
Learn about the application, working, and performance of 2-sample t-tests in R for comparing averages between two groups. Explore how t-values measure uncertainty and differences, along with assumptions and examples in R.

Uploaded on Mar 05, 2025 | 0 Views
Download Presentation

Please find below an Image/Link to download the presentation.
The content on the website is provided AS IS for your information and personal use only. It may not be sold, licensed, or shared on other websites without obtaining consent from the author.If you encounter any issues during the download, it is possible that the publisher has removed the file from their server.
You are allowed to download the files provided on this website for personal or commercial use, subject to the condition that they are used lawfully. All files are the property of their respective owners.
The content on the website is provided AS IS for your information and personal use only. It may not be sold, licensed, or shared on other websites without obtaining consent from the author.
E N D
Presentation Transcript
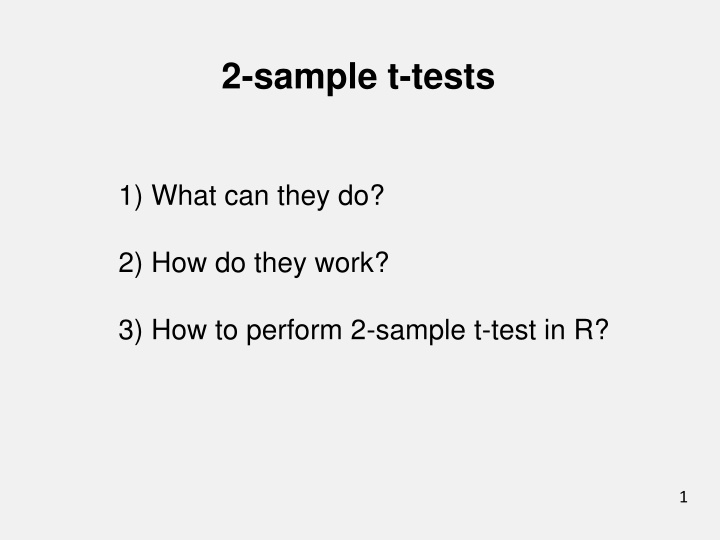
2-sample t-tests 1) What can they do? 2) How do they work? 3) How to perform 2-sample t-test in R? 1
Comparing averages between two groups i) How big is the difference between these two groups? ( and how much uncertainty accompanies this estimate?) ii) Do we have evidence whether the difference differs from zero? 2
2-sample t-test vs. 3 Orange by wuestenigel CC BY 2.0 Apple by idpams CC BY 2.0
2-sample t-test How does it work? X1 X2 sp t = 4
2-sample t-test How does it work? X1 X2 sp t = Measure of uncertainty in difference between means t-value essentially estimates the difference between two means, corrected for uncertainty in this difference What makes t big vs. small? THINK Difference between the means 5
2-sample t-test How does it work? X1 X2 sp t = Measure of uncertainty in difference between means Difference between the means t-value essentially estimates the difference between two means, corrected for uncertainty in this difference Bigger t: bigger difference in means, or less uncertainty 6
Assumptions of 2-sample t-test 1. Random sampling 2. Independence 3. Homogeneity of variances (no outliers) 4. Normality within each group (no outliers) Plot your data! 7
An example in R Set up data: 8
An example in R Set up data: 9
An example in R Set up data: What was the average size of apples and oranges? What is the difference (with uncertainty) between apples and oranges? 10
An example in R Set up data: Do our data suggest that apples and oranges differ in size, on average? 11
An example in R Set up data: Our samples indicates that, on average, apples (mean mass +/- SE: 11.9g +/- 0.3) and oranges (15.1 +/- 0.7) differ in mass by (95% CI) 1.43 4.86 g, which differs significantly from zero (2-sample t-test; t = 4.24, df = 8, p = 0.0028). Plot data; indicate sample size. 12