Water Quality - Measuring Turbidity of Different Water Sources
The activity involves comparing the turbidity of various natural and artificial water sources using a Labidsc turbidity sensor. Monitoring water quality is crucial for identifying pollutants, trends, and usage patterns in water resources. Factors like human activities affecting water quality through changes in essential variables are discussed. The impact on ecosystem goods and services is highlighted, emphasizing the economic implications of actions on water resources. Turbidity, a key parameter affecting water clarity and quality, is monitored to understand and control changes in water systems.

Download Presentation

Please find below an Image/Link to download the presentation.
The content on the website is provided AS IS for your information and personal use only. It may not be sold, licensed, or shared on other websites without obtaining consent from the author. Download presentation by click this link. If you encounter any issues during the download, it is possible that the publisher has removed the file from their server.
E N D
Presentation Transcript
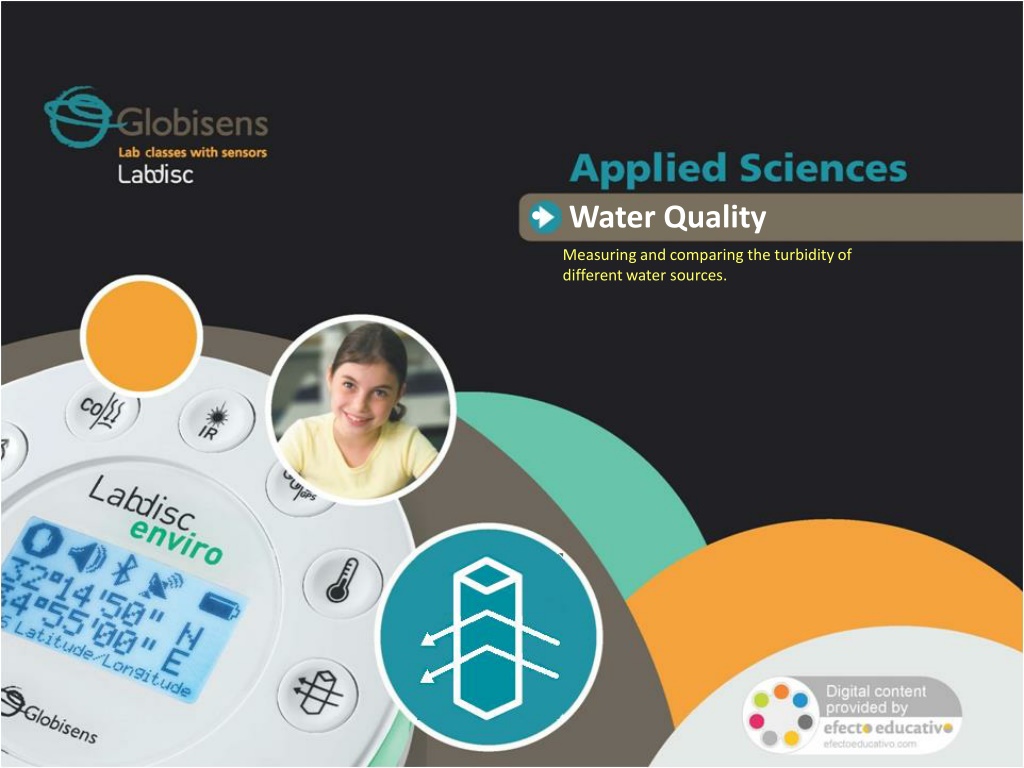
Water Quality Measuring and comparing the turbidity of different water sources.
Water Quality Measuring and comparing the turbidity of different water sources. Objective The purpose of this activity is to compare the turbidity of different natural and artificial water sources, evaluate a hypothesis and proceed to test it using the Labidsc turbidity sensor.
Water Quality Measuring and comparing the turbidity of different water sources. Introduction and theory The availability of fresh water is one of the most worrying environmental problems today. Humans have made unprecedent changes to meet growing demands for this natural resource. Water supplies affect many environmental processes and human communities, so that the conservation and sheltering of natural resources, including water is very important. Monitoring such precious resources is generally considered the primary way to identify pollutants, determine trends and evaluate water usage.
Water Quality Measuring and comparing the turbidity of different water sources. Introduction and theory What do you think obstructs natural water purification? Think of examples. What sort of water quality conditions do you think would have to be assess during a water quality monitoring? Carry out the experiment activity with your class so that at the end you ll be able to answer the following question: Is the quality different between samples of natural and artificial water sources?
Water Quality Measuring and comparing the turbidity of different water sources. Introduction and theory Theoretical Human beings act over the nature affecting directly or indirectly hydro resources, so that some essential variables, such as phosphorus and nitrogen levels, temperature and the amount of sediments are disturbed. This produces a change in water quality. Such changes can also alter the productivity and abundance of fishes, parasite abundance, algal blooms and water clarity. As a consequence, the ecosystem goods and services - safe drinking water, fishing, swimming, nature viewing and more - are modified. Considering an economic insight, it is important to understand that actions on nature and particularly on water resources have inevitable economic impacts on the goods and service offered by the ecosystem.
Water Quality Measuring and comparing the turbidity of different water sources. Introduction and theory The critical variables that alter the water quality (change drivers) can be monitored to control eventual changes. One of these is turbidity - a measurement of water clarity given by the material suspended (organic or inorganic). Higher turbidity mainly increases water temperature and, in turn, reduces both the dissolved oxygen and the amount of light penetrating the water. Now students are encouraged to raise a hypothesis which must be tested with an experiment. If you undertake a local monitoring of different hydro resources, including drinking water and natural sources of water. Where will you find the best and worst values of turbidity?
Water Quality Measuring and comparing the turbidity of different water sources. Activity description Students will measure the degree of water clarity in different natural and artificial water sources, evaluating one of the most important environmental drivers, the amount of sediments or turbidity. They will use the Labdisc turbidity sensor to measure this variable in the field.
Water Quality Measuring and comparing the turbidity of different water sources. Resources and materials Labdisc Enviro 1
Water Quality Measuring and comparing the turbidity of different water sources. Using the Labdisc a. Labdisc configuration To collect measurements with the turbidity sensor, the Labdisc must be configured following these steps: Turn on the Labdisc pressing . Press and select SETUP by pressing . Now select the option SET SENSORS with , and choose turbidity . Then press . Once you have done that, you will be back at the setup, press one time and select SAMPLING RATE with . Now, choose MANUAL . To go back to the measurements press three times. Start measuring with and press every time you want to record a data. Once you are finished measuring stop the Labdisc by pressing (you will see the instruction Press SCROLL key to STOP ) and press .
Water Quality Measuring and comparing the turbidity of different water sources. Experiment First, calibrate the turbidity sensor introducing the cuvette full of drinking water into the sensor. Then, press and hold the turbidity key for 3 seconds until a long beep is heard. Select different natural water sources, such as ponds, lagoons or lakes around your local environment. Take a few ml. water samples from every site, including artificial water sources i.e. artificial lagoons - and drinking water. Label them and note observations about the appearance of water.
Water Quality Measuring and comparing the turbidity of different water sources. Experiment Fill the cuvette to a 75% volume with the samples and measure the turbidity, being sure the cuvette is dry outside. Under proper conditions, you could measure directly in the field, following the previous suggestions.
Water Quality Measuring and comparing the turbidity of different water sources. Results and analysis Select a bar graph from the GlobiLab menu to show the experiment results. Then, label the bars indicating the name or zone where the samples were taken. Use the tool from the GlobiLab software. Observe the table data clicking on , if you wanted to know precisely the close values between two or more samples.
Water Quality Measuring and comparing the turbidity of different water sources. Results and analysis Do you think there a correlation between the appearance of samples and the objective measurements of turbidity? Which water samples showed either minimum or maximum values of turbidity? Considering your experimental results, is it possible to cluster the samples under any criterion? If so, are there big or small differences between the clusters? Were your expectations and your initial hypothesis fulfilled? Explain.
Water Quality Measuring and comparing the turbidity of different water sources. Results and analysis The graph below should be similar to the one the students came up with:
Water Quality Measuring and comparing the turbidity of different water sources. Conclusion Why can turbidity be considered a reliable measure of water quality? Students should point out based on the theoretical background that the turbidity shows objectively the amount of sediments or suspended material, which indirectly is related to the water temperature, the dissolved oxygen and the availability of light. What can you conclude and infer from the experiment results? Students should conclude there is a notorious difference between the artificial and natural sources of water. This could be explained by considering the purification process made by water supply plants. Probably, the turbidity found in natural sources of water is related to soil erosion and organic suspensions. Differences between lakes and ponds could be based on the different water volumes.
Water Quality Measuring and comparing the turbidity of different water sources. Conclusion Do you consider the values of turbidity to be a sign of healthy or unhealthy water? Students should answer this question critically, because drinking water showed high values of turbidity, however it is safe. The suspension particles are not necessarily pathological, so that the turbidity must be complemented with other types to analyze and determine healthy or unhealthy water.
Water Quality Measuring and comparing the turbidity of different water sources. Activities for further application What do you think are the main sources of environmental water turbidity? Search additional information to complement your answer. There are a broad variety of sources. The most common natural sources are soil erosion, eroding stream banks, large numbers of bottom feeders these animals stir up bottom sediments and excessive algal growth. Humans also contribute directly through waste discharge and urban runoff. How could you improve the turbidity condition of water in your house? The students could suggest the use of filters at the tap, or the condensation of the steam obtained from boiled water in order to diminish the water turbidity. Those are alternatives to eliminate solutes from the water.