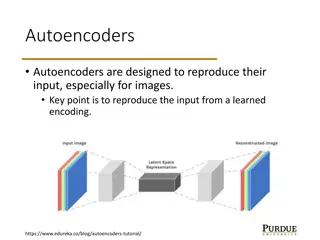
Understanding Latent Transition Analysis: A Comprehensive Overview
Latent Transition Analysis (LTA) is a statistical method that identifies unobservable groups within a population using observed variables, aiding in profiling individuals and tracking transitions over time. It is particularly useful for modeling categorical constructs, informing prevention and intervention efforts, and assessing developmental changes. LTA involves steps like studying measurement models, exploring transitions, and specifying latent transition models.
- Latent Transition Analysis
- Statistical Method
- Unobservable Groups
- Measurement Models
- Categorical Constructs

Download Presentation

Please find below an Image/Link to download the presentation.
The content on the website is provided AS IS for your information and personal use only. It may not be sold, licensed, or shared on other websites without obtaining consent from the author. Download presentation by click this link. If you encounter any issues during the download, it is possible that the publisher has removed the file from their server.
E N D
Presentation Transcript
LATENT TRANSITION ANALYSIS A Gentle Introduction . Hopefully Angela B. Bradford, PhD, LMFT School of Family Life Brigham Young University
Background Mixture Models (aka finite mixture models )- Models based on the idea that there are multiple characteristically different sub-populations within the population, and that those subpopulations are not directly observable. Mixture models characterize and estimate parameters for those sub-populations Different Genders are directly observable (well . they used to be), so that s not an example; Different kinds of Awesome Assistant Professors may not be directly observable, so a mixture model could help characterize them Latent Transition Analysis is a type of Mixture Model and an extension of the Latent Class Analysis
But what is a Latent Class Analysis? you ask. Latent Class Analysis identifies unobservable groups (or categories) within a population, using observed variables/ indicators. Similar to a factor analysis, but the latent variable is categorical, rather than continuous. LCA usually refers to models in which the indicators are categorical; Latent Profile Analysis (LPA) usually refers to the models in which the indicators are continuous. Aside from why you ve theoretically chosen to model continuous data by chunking it up into categories, there are very few- if any- practical differences in modeling and interpretation of results.
Latent Class Analysis/ Latent Profile Analysis e1 e2 e3 X1 X2 X3 These are your conditional item probabilities or loadings . Will represent means of each X in an LPA. C
Latent Transition Analysis e11 e21 e31 e12 e22 e32 X12 X22 X32 X11 X21 X31 C1 C2 This is the transition in class memberships from Time 1 to Time 2
So why conduct an LTA? Ideal for modeling categorical, multivariate constructs developmentally (where growth modeling is not as well- suited) Useful for identifying profiles of individuals that move into categories that are more/less functional, risky, or whatever Can thereby inform prevention and intervention efforts Others?
How to conduct an LTA (from Nylund, 2007) Step 0: Study descriptive statistics Step 1: Study measurement model alternatives for each time point (using LCA / LPA) Step 2: Explore transitions based on cross-sectional results; Test measurement invariance if the same number and types of classes emerge in Step 1 Step 3: Explore specification of the latent transition model without covariates Step 4: Include covariates in the LTA model Step 5: Include distal outcomes and advanced modeling extensions (e.g., multi-level LTA)
An Example (for Examples sake only) Adolescents from families with conflict/ interpersonal stress often have negative outcomes, particularly when there are parent-child problems, such as psychological control (Barber, 1996; Patterson, DeBaryshe, & Ramsey, 1989; Steeger & Gondoli, 2013; Vinita & Saroj, 2012) Many adolescents, however, show resilience to those stressors The literature has focused singularly on resilience factors, rather than profiles of resilience that could inform intervention Such factors are internal locus of control, self-esteem, and emotional regulation (Alvord & Grados, 2005; Masten & Coatsworth, 1998).
Cont. Because adolescent romantic relationships are linked to many facets of well-being (Adler-Baeder, Kerpelman, Schramm, & Paulk, 2007), teaching them healthy relationship skills may improve their resilience. There has been some work indicating that adolescents improve in these individual domains after participation in Relationship Education classes (e.g., Adler-Baeder et al., 2007). However, no work on whether youth in difficult family situations develop more functional profiles of resilience after RE participation has been done.
Sample Participants are drawn from a sample of adolescents who received an average of 12 hours of RE as part of the Alabama Health Marriage and Relationship Education Initiative (www.alabamamarriage.org). Analytic sample (N=125) is comprised of youth who reported scores 1 standard deviation removed from the mean on measures of parental psychological control, parent support, and family harmony. I can send you demographic information if you really want it.
Measures Internal locus of control Self-esteem Reflective Coping (similar to emotional regulation) Covariates: Conflict Management difference score (improvement in conflict management)
Step 2a: Explore transitions based on cross-sectional results Each LCA gives you class counts and proportions; use these to create a crosstabulation table Time 1 Time 2 Class 1 Low resilience .213 .264 Class 2 Moderate resilience w/ low ILOC .787 .736
Step 2b: Test measurement invariance if the same number and types of classes emerge in Step 1 You can use the usual Likelihood Ratio Difference Test (Likelihood Ratio distributed as chi-square, so a delta chi- square test) and the AIC and BIC You can have: Full Noninvariance- Conditional Item Probabilities (w/ categorical indicators) or Loadings are freely estimated for each timepoint Partial Invariance- Some loadings are constrained others are freely estimated for each timepoint Full Invariance- All loadings are constrained to be equal across time In my case, tests indicated the model should be specified as fully noninvariant This means my classes are different at Time 2 than they were at Time 1
Step 3: Explore specification of the latent transition model without covariates These are latent transition probabilities from Mplus output. Full Invariance Full NonInvariance T2 Class 1 (resilient) T2 Class 2 (non) T2 Class 1 (non) T2 Class 2 (resilient) T1 Class 1 (non) .292 .708 T1 Class 1 (resilient) .805 .195 T1 Class 2 (resilient) .178 .822 T1 Class 2 (non) .126 .874
Step 4: Include covariates in the LTA model e11 e21 e31 e12 e22 e32 X12 X22 X32 X11 X21 X31 C1 C2 x
Covariate effects (multinomial logistic regression) Latent Class Pattern 1 1 Estimate S.E. p-value Estimate/ S.E. C2#1 ON CONMGT 0.704 0.405 1.740 0.082 Latent Class Pattern 2 1 C2#1 ON CONMGT 0.394 0.363 1.085 0.278 If these were significant, you could look at the odds ratio to help you interpret what they mean. (E.g., The odds ratio of C2#1 ON conmgt is e(.704) = 2.02, so for every unit increase in conmgt, people are 102% more likely to stay in class 1 vs. moving to class 2 at Time 2.)
Relevant Mplus code (LCA or LPA) IDVARIABLE=ID; !Tells you which of your variables is the identifier for each case CLASSES = c (2); !Specifies that there should be two classes in the model. When model testing, this is the value you change as you examine how many classes are the most appropriate USEVARIABLES T1iloc T1esteem T1refcop; !Which variables are indicators of your classes MISSING are all(999); !What missing values are in my dataset ANALYSIS: TYPE = MIXTURE; !It's a mixture model LRTSTARTS= 50 10 75 20; !If you have difficulty with convergence, you can increased starts and stops Plot: type is plot3; !Gives you a plot of the indicator means for each class series is T1iloc (1) T1esteem (2) T1refcop (3); !Defines which variable is 1st, 2nd, and so on SAVEDATA: !Saves a new SPSS file that gives you the probability of each case belonging to each of the classes and the most likely class membership file is T1classes.sav; save is cprobabilities; OUTPUT: SAMPSTAT STANDARDIZED TECH11 TECH14; !The usual; TECH14 gives you the LMR and BLRT tests of model fit, testing the hypothesis that k-1 classes is better fitting than k classes
LTA, no covariates IDVARIABLE=id; !Which variable is the identifier CLASSES = c1 (2) c2(2); !Specifies how many time points (c1 is one and c2 is the second) and how many classes each timepoint has (2 in each) USEVARIABLES T1iloc T1esteem T1refcop T2iloc T2esteem T2refcop; !Which variables are indicators of the latent classes at each timepoint MISSING are all(999); !Missing values ANALYSIS: TYPE = MIXTURE; !Still a mixture model MODEL: %OVERALL% !The overall model specification c2 ON c1; !regresses c2 on c1 (for the latent transition probabilities) MODEL c1: !Specification/ measurement model for each class at Time 1 %c1#1% !Time 1, class 1 [T1iloc]; !These loadings/means can be constrained when testing measurement invariance across time [T1esteem]; [T1refcop]; %c1#2% !Time 1, class 2 [T1iloc]; [T1esteem]; [T1refcop];
LTA specification (cont.) MODEL c2: !Specification/ measurement model for each class at Time 2 %c2#1% !Time 2, class 1 [T2iloc]; [T2esteem]; [T2refcop]; %c2#2% !Time 2, class 2 [T2iloc]; [T2esteem]; [T2refcop]; OUTPUT: SAMPSTAT STANDARDIZED TECH1 TECH8 TECH15;
LTA with covariates Everything up to the model specification is the same (w/ the addition of the covariate to USEVARIABLES). MODEL: %OVERALL% c2 ON c1; !Latent transition specification c1 ON covariate; !Tests the covariate's influence on c1 (on which the transition probability is dependent) MODEL c1: %c1#1% [T1iloc]; [T1esteem]; [T1refcop]; c2 ON covariate; !Tests the interaction of the transition and the covariate for those starting in class 1 %c1#2% [T1iloc]; [T1esteem]; [T1refcop]; c2 ON covariate; !Tests the interaction of the transition and the covariate for those starting in class 2 MODEL c2: %c2#1% [T2iloc]; [T2esteem]; [T2refcop]; %c2#2% [T2iloc]; [T2esteem]; [T2refcop]; OUTPUT: SAMPSTAT STANDARDIZED TECH1 TECH8 TECH15;
A couple of helpful sources on LTA: Collins, L.M., & Lanza, S.T. (2010). Latent Class and Latent Transition Analysis: With applications in the social, behavioral, and health sciences. Hoboken, NJ: John Wiley & Sons, Inc. Lanza, S.T., Patrick, M.E., & Maggs, J.L. (2010). Latent transition analysis: Benefits of a latent variable approach to modeling transitions in substance use. Journal of Drug Issues, 40, 93-120. Nylund (2007) Doctoral dissertation: Latent Transition Analysis: Modeling Extensions and an Application to Peer Victimization (Chapter 2): available at https://www.statmodel.com/download/nylunddis.pdf
References: Adler-Baeder, F., Kerpelman, J. L., Schramm, D. G., Higginbotham, B., & Paulk, A. (2007). The impact of relationship education on adolescents of diverse backgrounds. Family Relations, 56(3),291-303. doi: 10.1111/j.1741- 3729.2007.00460.x Alvord, M. K. & Grados, J. J. (2005). Enhancing resilience in children: a proactive approach. Professional Psychology: Research and Practice, 36(3),238-245. doi:10.1037/0735-7028.36.3.238 Barber, B. K. (1996). Parental psychological control: Revisiting a neglected construct. Child Development, 67(6), 3296-3319. doi:10.2307/1131780 Masten, A.S. & Coatsworth, J.D. (1998). The development of competence in favorable and unfavorable environments: lessons from research on successful children. American Psychologist, 53(2),205-220. doi:10.1037/0003- 066X.53.2.205 Patterson, G. R., DeBaryshe, B. D., & Ramsey, E. ( 1989). A developmental perspective on antisocial behavior. American Psychologist, 44, 329 335. Steeger, C. M., & Gondoli, D. M. (2013). Mother adolescent conflict as a mediator between adolescent problem behaviors and maternal psychological control. Developmental Psychology, 49(4), 804-814. doi:10.1037/a0028599 Vinita, T., & Saroj, V. (2012). General health of adolescents in relation to perceived parental psychological control. Social Science International, 28(1), 59- 73.


")


")

")