Understanding Livestock Economics and Marketing: Theories and Concepts


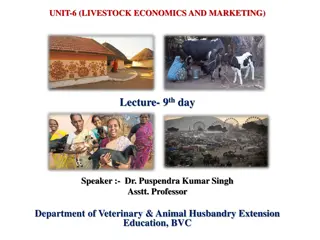
UNIT-6 (LIVESTOCK ECONOMICS AND MARKETING)
UNIT-6 (LIVESTOCK ECONOMICS AND MARKETING)
Lecture- 5
Lecture- 5
th
th
day
day
Speaker :- Dr. Puspendra Kumar Singh
Speaker :- Dr. Puspendra Kumar Singh
Asstt. Professor
Asstt. Professor
Department of Veterinary & Animal Husbandry Extension
Department of Veterinary & Animal Husbandry Extension
Education, BVC
Education, BVC

Topics covered
•
Theories of cost.
Cost Concept
•
Have relevance to a specific time period
•
Consideration of cost curves is essential & forms the basis for entry & exit
of the firms in the industry.
•
Profit maximizing rule is determined with the help of cost curves, cost
functions & production functions.
•
The costs are also one of the major price determinants in all the market
situations.
•
The knowledge regarding the cost functions is very much essential for
optimal managerial decisions to be taken by the firm as well as the
Government
Meaning
•
Cost of production means the expenses incurred per unit of output
•
Cost of production means value of factor of production
•
Costs are defined as those expenses faced by a business in the
process of supplying goods and services to consumers.
•
Costs in farming divided into two main categories FC & VC
Fixed costs
•
Known as indirect costs/sunk costs/overhead costs
•
Does not vary during the production period
•
Incurred even when production is not undertaken
•
Remain same irrespective of level of production
•
In long run there are no fixed costs
•
eg. taxes, rent, insurance, depreciation, interest on investment,
implements, tools, buildings, hired labour on a year round basis etc.
•
The summation of all these costs is called TFC
•
However in long run, all costs become variable.
•
Parallel to X-axis
Total fixed costs
Output
Cost
y
x
TFC
O
Variable Costs
•
Known as working/operating/direct/ prime/circulating/running costs
•
An input is a variable input if its quantity varies during the production
period.
•
Vary with the level of output
•
Not incurred in absence of production
eg. costs of raw materials, labour hired on daily basis, power, repairs,
maintenance charges of machinery etc.
•
These are second phase costs.
•
The summation of these costs refers to TVC
•
Graphically TVC is as inverse ‘S’ shape
Total variable costs
Output
Cost
y
x
TVC
O
Total Costs
•
These include total fixed costs as well as total
variable costs.
•
Its shape is similar to that of TVC
Total costs
Output
Cost
y
x
TC
O
TFC
Average Fixed Costs
•
It is the cost of fixed inputs required for producing one unit of
output
TFC
AFC =
Output
•
As output increases, AFC continues to decline
•
When output is zero, AFC=TFC
•
It is having the shape of hyperbola
Average Fixed costs
Output
Cost
y
x
O
AFC
Average Variable Costs
•
It is the amount spent on the variable inputs to produce an unit of
output
TVC
AVC =
Output
•
AVC decreases, reaches a minimum and increases thereafter.
•
Can not be computed when output is zero
Average Variable costs
Output
Cost
y
x
AVC
O
Average Total Costs
•
Similar to AVC, first decreases, attains a
minimum and increases thereafter.
TC
ATC/AC =
Output
•
ATC is the cost of producing one unit of
output
Average Total costs
Output
Cost
y
x
ATC/AC
O
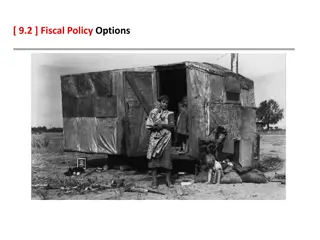
Marginal Costs
•
Change in TC in response to a unit increase in
output
∆TC or ∆TVC
MC =
∆ Output
•
MC curve decreases first, reaches its minimum
point & then raises upwards and passes through
AVC & AC at their minimum points
•
AVC & AC will slope downwards & keep
falling as long as MC is below them
Average & Marginal costs
Output
Cost
y
x
ATC
O
MC
AVC
Cost function
•
Arithmetically (tabular form)
•
Geometrically (graphic form)
•
Algebraically (equation form)
Relationship between
TFC, TVC & TC
•
TFC remains unchanged
•
TVC is zero, when output is zero
•
TC is the sum of TFC and TVC
•
TC=TFC, when no variable input added
•
TC curve is shaped exactly like the TVC
curve, but is placed above the TVC
Illustration 1
Illustration 2
•
Assume paneer centre started with fixed cost
Rs.40/per day for rented paneer press
machine for 3 months
•
If the firm produces 100 units of paneer in a
day, its wages for labour is Rs. 500. When
produces 150 units labour cost increases to Rs.
700.
Explicit cost (cash cost)
•
Also called as paid out costs
•
Incurred when resources are purchased & used
immediately in the production process
•
Non durable input such as fuel, oil, casual
labour, feed etc
Implicit cost (non-cash cost)
•
Entrepreneur do not pay for the use of owned
resources.
•
Consist of depreciation & payments to
resources owned by the farmer
•
Depreciation on equipment, buildings,
payments made to the farmer himself or family
labour, management & owned capital
Opportunity cost
•
Income that can be earned in the next best
alternative use
eg. Concentrate feed which can either fed to
cows or sold
Depreciation cost
•
It is the loss or decline in value which occurs in
time due to wear and tear with items of farm
property such as building, equipment, machinery
and livestock etc.
Social costs
•
Also called as externalities
•
From the point of view of society, the firms will
give rise to some additional costs to the society in
the form of environmental degradation, water/air
or noise pollution in the area.
•
Profit is dependent on three basic factors viz. Cost of production, selling price
and volume of sales
•
Indicates costs-volume-profit relations in the short run
•
The point at which the two curves i.e. TR & TC intersect is called the break-
even point (BEP).
•
Also called as “point of no profit & no loss”, “balancing point”, “neutral point”,
“equilibrium point”, “loss ending point” and “profit beginning point”.
•
BEP nearer to origin indicates less loss and more profit zones
Break even analysis
Break even point
Cost & revenue (Rs.)
BEP
y
0
x
Units of output
TR
TC
FC
Loss
Profit
BEO
Calculation of BEP
Fixed cost
Break-even Output =
Contribution per unit
Contribution per unit = Sales revenue (P) - Variable cost (V)
Illustration 1: Calculate BEP
Fixed expenses
Rs. 1,50,000
Variable cost per unit
Rs. 10
Selling price per unit
Rs. 15
BEP (in units)
=
30,000 units
BEP (in rupees)
=
Rs. 4,50,000
Fixed cost
Break-even Output =
Contribution per unit
Illustration 2: Calculate BEP
Sales
Rs.6,00,000
Fixed expenses
Rs.1,50,000
Variable costs:
Direct Material
Rs.2,00,000
Direct Labour
Rs.1,20,000
Other Variable expenses
Rs.80,000
Fixed cost
Break-even Output = X Sales
Contribution(S-V)
BEP (in rupees)= Rs.4,50,000
When per unit cost & selling price are not given, B.E.P. can be
calculated only in terms of Rupees.
Illustration - 3: From the following particulars find out the B.E.P.
What will be the selling price per unit if B.E.P. is to be brought
down to 9,000 units?
Variable cost per unit Rs.75, Fixed expenses Rs.
2,70,000, selling price per unit Rs.100
BEP (in units)
= 10800 units
Fixed expenses per unit
= 270000/9000= Rs.30
Selling price= Fixed expenses+Variable expenses
= Rs.30 + Rs.75 = Rs.105
Example:
•
Find out BEP of a sheep herd with following
information:
–
Total Fixed cost = Rs. 10000
–
Number of sheep=100
–
Variable cost of production= Rs.60000
–
Gross return = Rs. 100000
Margin of Safety
•
The amount by which the actual volume of sales
exceeds the sales at BEP
•
Margin of safety = Actual sales – Break even sales
•
When the margin of safety is low, the following
steps may be taken.
1) Increase the volume of sales,
2) Increase the selling price,
3) Decrease the fixed costs,
4) Decrease the variable costs,
5) Improve the sales mix
•
The angle formed at BEP between the two lines to
the right side of the BEP is called angle of
incidence
•
A large margin of safety with wide angle of
incidence indicates most favourable position of a
business and even the existence of monopoly
positions.
Break even chart and
Angle of incidence
Break even point
Cost & revenue (Rs.)
BEP
y
0
x
Units of output
TR
TC
FC
Loss
Profit
BEO
Shut down point
•
Shut down point is the minimum point of
average variable cost.
•
A farmer must produce at least this amount so
that he will be able to cover the variable cost
of production.
•
If the total revenue curve goes below this
point, it is better to close the business instead
of incurring losses.
Explore the essential theories and concepts in livestock economics and marketing discussed by Dr. Puspendra Kumar Singh. Topics include cost theories, cost functions, production functions, fixed costs, variable costs, and their relevance to managerial decisions and market situations.

Download Presentation

Please find below an Image/Link to download the presentation.
The content on the website is provided AS IS for your information and personal use only. It may not be sold, licensed, or shared on other websites without obtaining consent from the author. Download presentation by click this link. If you encounter any issues during the download, it is possible that the publisher has removed the file from their server.
E N D
Presentation Transcript
UNIT-6 (LIVESTOCK ECONOMICS AND MARKETING) Lecture- 5thday Speaker :- Dr. Puspendra Kumar Singh Asstt. Professor Department of Veterinary & Animal Husbandry Extension Education, BVC
Topics covered Theories of cost.
Cost Concept Have relevance to a specific time period Consideration of cost curves is essential & forms the basis for entry & exit of the firms in the industry. Profit maximizing rule is determined with the help of cost curves, cost functions & production functions. The costs are also one of the major price determinants in all the market situations. The knowledge regarding the cost functions is very much essential for optimal managerial decisions to be taken by the firm as well as the Government
Meaning Cost of production means the expenses incurred per unit of output Cost of production means value of factor of production Costs are defined as those expenses faced by a business in the process of supplying goods and services to consumers. Costs in farming divided into two main categories FC & VC
FC MC VC Cost ATC TC AVC AFC
Fixed costs Known as indirect costs/sunk costs/overhead costs Does not vary during the production period Incurred even when production is not undertaken Remain same irrespective of level of production In long run there are no fixed costs eg. taxes, rent, insurance, depreciation, interest on investment, implements, tools, buildings, hired labour on a year round basis etc. The summation of all these costs is called TFC However in long run, all costs become variable. Parallel to X-axis
Total fixed costs y TFC Cost O x Output
Variable Costs Known as working/operating/direct/ prime/circulating/running costs An input is a variable input if its quantity varies during the production period. Vary with the level of output Not incurred in absence of production eg. costs of raw materials, labour hired on daily basis, power, repairs, maintenance charges of machinery etc. These are second phase costs. The summation of these costs refers to TVC Graphically TVC is as inverse S shape
Total variable costs y TVC Cost O x Output
Total Costs These include total fixed costs as well as total variable costs. Its shape is similar to that of TVC
Total costs y TC Cost TFC O x Output
Average Fixed Costs It is the cost of fixed inputs required for producing one unit of output TFC AFC = Output As output increases, AFC continues to decline When output is zero, AFC=TFC It is having the shape of hyperbola
Average Fixed costs y Cost AFC O x Output
Average Variable Costs It is the amount spent on the variable inputs to produce an unit of output TVC AVC = Output AVC decreases, reaches a minimum and increases thereafter. Can not be computed when output is zero
Average Variable costs y AVC Cost O x Output
Average Total Costs Similar to AVC, first decreases, attains a minimum and increases thereafter. ATC/AC = ATC is the cost of producing one unit of output TC Output
Average Total costs y ATC/AC Cost O x Output
Marginal Costs Change in TC in response to a unit increase in output TC or TVC MC = Output MC curve decreases first, reaches its minimum point & then raises upwards and passes through AVC & AC at their minimum points AVC & AC will slope downwards & keep falling as long as MC is below them
Average & Marginal costs y ATC MC AVC Cost O x Output
Cost function Arithmetically (tabular form) Geometrically (graphic form) Algebraically (equation form)
Relationship between TFC, TVC & TC TFC remains unchanged TVC is zero, when output is zero TC is the sum of TFC and TVC TC=TFC, when no variable input added TC curve is shaped exactly like the TVC curve, but is placed above the TVC
Illustration 1 Output TFC TVC TC AC MC 0 50 100 150 200 250 300 350 400 450 500 200 200 200 200 200 200 200 200 200 200 200 0 200 300 400 450 460 465 480 525 600 810 1050 100 200 250 260 265 280 325 400 610 850 6 4 3 2 2 1 2.3 1.86 1.6 1.5 1.5 1.8 2.1 0.2 0.1 0.3 0.9 1.5 4.2 4.8
Illustration 2 Assume paneer centre started with fixed cost Rs.40/per day for rented paneer press machine for 3 months If the firm produces 100 units of paneer in a day, its wages for labour is Rs. 500. When produces 150 units labour cost increases to Rs. 700. Quantity /day 100 FC VC TC AFC AVC ATC MC 40 500 540 0.40 5.00 5.40 4 40 700 740 0.27 4.67 4.93 150
Explicit cost (cash cost) Also called as paid out costs Incurred when resources are purchased & used immediately in the production process Non durable input such as fuel, oil, casual labour, feed etc
Implicit cost (non-cash cost) Entrepreneur do not pay for the use of owned resources. Consist of depreciation & payments to resources owned by the farmer Depreciation on equipment, payments made to the farmer himself or family labour, management & owned capital buildings,
Opportunity cost Income that can be earned in the next best alternative use eg. Concentrate feed which can either fed to cows or sold
Depreciation cost It is the loss or decline in value which occurs in time due to wear and tear with items of farm property such as building, equipment, machinery and livestock etc.
Social costs Also called as externalities From the point of view of society, the firms will give rise to some additional costs to the society in the form of environmental degradation, water/air or noise pollution in the area.
Break even analysis Profit is dependent on three basic factors viz. Cost of production, selling price and volume of sales Indicates costs-volume-profit relations in the short run The point at which the two curves i.e. TR & TC intersect is called the break- even point (BEP). Also called as point of no profit & no loss , balancingpoint , neutralpoint , equilibriumpoint , loss ending point and profit beginning point . BEP nearer to origin indicates less loss and more profit zones
Break even point TR y TC Profit BEP Cost & revenue (Rs.) Loss FC BEO 0 x Units of output
Calculation of BEP Fixed cost Break-even Output = Contribution per unit Contribution per unit = Sales revenue (P) - Variable cost (V)
Illustration 1: Calculate BEP Fixed expenses Variable cost per unit Selling price per unit Rs. 1,50,000 Rs. 10 Rs. 15 Fixed cost Break-even Output = Contribution per unit BEP (in units) BEP (in rupees) = = 30,000 units Rs. 4,50,000
Illustration 2: Calculate BEP Sales Fixed expenses Variable costs: Direct Material Direct Labour Other Variable expenses Rs.1,50,000 Rs.6,00,000 Rs.2,00,000 Rs.1,20,000 Rs.80,000 Fixed cost Break-even Output = X Sales Contribution(S-V) BEP (in rupees)= Rs.4,50,000 When per unit cost & selling price are not given, B.E.P. can be calculated only in terms of Rupees.
Illustration - 3: From the following particulars find out the B.E.P. What will be the selling price per unit if B.E.P. is to be brought down to 9,000 units? Variable cost per unit Rs.75, Fixed expenses Rs. 2,70,000, selling price per unit Rs.100 BEP (in units) = 10800 units Fixed expenses per unit = 270000/9000= Rs.30 Selling price= Fixed expenses+Variable expenses = Rs.30 + Rs.75 = Rs.105
Example: Find out BEP of a sheep herd with following information: Total Fixed cost = Rs. 10000 Number of sheep=100 Variable cost of production= Rs.60000 Gross return = Rs. 100000
Margin of Safety The amount by which the actual volume of sales exceeds the sales at BEP Margin of safety = Actual sales Break even sales When the margin of safety is low, the following steps may be taken. 1) Increase the volume of sales, 2) Increase the selling price, 3) Decrease the fixed costs, 4) Decrease the variable costs, 5) Improve the sales mix
Break even chart and Angle of incidence The angle formed at BEP between the two lines to the right side of the BEP is called angle of incidence A large margin of safety with wide angle of incidence indicates most favourable position of a business and even the existence of monopoly positions.
Break even point TR y TC Profit BEP Cost & revenue (Rs.) Loss FC BEO 0 x Units of output
Shut down point Shut down point is the minimum point of average variable cost. A farmer must produce at least this amount so that he will be able to cover the variable cost of production. If the total revenue curve goes below this point, it is better to close the business instead of incurring losses.
")


")
")