Understanding Expander Families and Ramanujan Graphs
An introduction to expander families and Ramanujan graphs by Tony Shaheen from CSU Los Angeles. The discussion covers the concept of regular graphs, motivation behind expander families, communication networks, and the goal of creating an infinite sequence of d-regular graphs optimized for communicat
0 views • 54 slides
Exploring Product and Knowledge Graphs for Enhanced Information Retrieval
Dive into the world of product and knowledge graphs, uncovering the journey to a rich product graph, examples of knowledge graphs for songs, and the mission to provide comprehensive information on products and related knowledge. Discover use cases ranging from information provision to enhancing sear
3 views • 76 slides
Understanding Diffusion Weighted Imaging (DWI) in Neuroimaging Research
This content delves into the significance of Diffusion Weighted Imaging (DWI) in studying the motion of water molecules in brain tissue. It explains how water diffusion varies in different brain matter types and explores techniques like Diffusion Tensor Imaging (DTI). The impact factors on diffusion
4 views • 25 slides
Understanding Non-Weighted Codes and Excess-3 Code in Binary Systems
Explore non-weighted binary codes like Excess-3 code, learn how to convert decimal numbers to XS-3 code, advantages and disadvantages of BCD codes, and steps to convert Excess-3 code to binary. Discover the intricacies of binary coding systems with practical examples.
5 views • 55 slides
Understanding Your GPA: Weighted vs. Unweighted, College Admission, and Scholarships
GPA, or Grade Point Average, plays a crucial role in college admission and scholarship opportunities. Understanding the difference between weighted and unweighted GPAs is essential. Weighted GPAs give more weight to advanced classes like AP and Dual Enrollment, impacting your overall GPA calculation
0 views • 11 slides
SHRA Performance Appraisal Policy Guidelines
The SHRA Performance Appraisal Policy outlines the performance cycle, expectations, responsibilities, calibration sessions, setting of expectations, weighted goals, and more. Employees are encouraged to actively participate, ask questions, and keep supervisors informed. Supervisors are expected to p
0 views • 39 slides
Exploring Various Types of Graphs in Statistics Education
Delve into the world of data visualization with slow reveal graphs, column graphs, pictographs, dot plots, divided bar graphs, sector graphs, line graphs, and stem-and-leaf plots. Engage in observations and wonderings to enhance statistical comprehension and analytical skills.
1 views • 8 slides
Exploring Graphs: An Introduction to Data Visualization
This chapter delves into various types of graphs used in data representation, such as bar graphs, pie graphs, histograms, line graphs, and linear graphs. It explains the purpose and structure of each graph type, along with practical examples. Additionally, it covers the Cartesian system for locating
0 views • 15 slides
Understanding Bar Graphs, Double Bar Graphs, and Histograms
Bar graphs are useful for displaying and comparing data, while double bar graphs help compare two related datasets. Histograms show the distribution of data. Learn how to interpret and create these visual representations effectively with examples provided.
0 views • 20 slides
Primal-Dual Algorithms for Node-Weighted Network Design in Planar Graphs
This research explores primal-dual algorithms for node-weighted network design in planar graphs, focusing on feedback vertex set problems, flavors and toppings of FVS, FVS in general graphs, and FVS in planar graphs. The study delves into NP-hard problems, approximation algorithms, and previous rela
0 views • 17 slides
Understanding Graphs of Straight Lines and Equations
Learn how to graph equations and find equations from graphs of straight lines. Explore tables of values, plotting points on a coordinate plane, drawing lines through points, and identifying relationships between graphs and algebraic expressions. Discover the gradient-intercept form of a straight lin
0 views • 14 slides
Understanding Speed vs. Time Graphs: Analyzing Acceleration and Motion
Explore the concept of speed vs. time graphs and learn how to recognize acceleration, interpret speed, analyze motion, and calculate acceleration from the slope of the graph. Discover the characteristics of graphs showing constant acceleration, varying acceleration, and deceleration. Engage in drawi
0 views • 19 slides
Understanding Weighted Moving Average Charts for Process Monitoring
Weighted moving average charts are powerful tools for detecting small shifts and trends in process means. By utilizing Uniformly Weighted Moving Average (UWMA) charts and Exponentially Weighted Moving Average (EWMA) charts, organizations can monitor and identify changes in process means with precisi
1 views • 29 slides
Noise & Error Shaping in Discrete-Time DSMs EECT 7V88 - Fall 2021
Explore the intricacies of noise and error shaping in DSMs with Professor Y. Chiu's course on Discrete-Time DSMs for EECT 7V88 in Fall 2021. Delve into DAC architectures including Nyquist, binary-weighted, and more. Learn about Binary-Weighted CR DAC, CP Cu, capacitor arrays, gain errors, nonlineari
1 views • 30 slides
Understanding the Cost of Capital in Finance
The cost of capital is crucial for businesses to determine the average cost of their finance. The Weighted Average Cost of Capital (WACC) is used as a discount rate in financial calculations. It involves estimating the cost of each source of finance and calculating a weighted average. Additionally,
0 views • 14 slides
Understanding Weighted Price Indices in Economics
Weighted price indices are essential in economics to measure changes in prices over time. Different methods such as Laspeyre's and Paasche's price indices offer ways to calculate these indices using weighted averages. Fisher's index combines both methods to provide a comprehensive view. The weighted
3 views • 9 slides
Sewing Club Making Weighted Bibs for Infants at MUSC Children's Hospital
Our Buist Sewing Club, inspired by the unity during the Bosnian War, creates weighted bibs for infants at MUSC Children's Hospital. These bibs provide comfort and aid in circulation post-surgery, benefitting over 137,000 children annually. Through our diverse group, we aim to make a positive impact
0 views • 15 slides
Representation of Abstract Groups through Graphs
Explore the representation of abstract groups as automorphism groups of graphs, touching on topics such as the existence of graphs whose automorphism groups are isomorphic to given abstract groups, the cardinality of connected graphs satisfying specific properties, and questions regarding the cardin
0 views • 16 slides
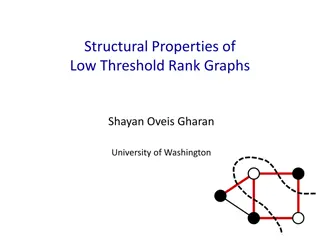
Understanding Low Threshold Rank Graphs and Their Structural Properties
Explore the intriguing world of low threshold rank graphs and their structural properties, including spectral graph theory, Cheeger's inequality, and generalizations to higher eigenvalues. Learn about the concept of threshold rank, partitioning of graphs, diameter limits, and eigenvectors approximat
0 views • 22 slides
Exploring Types of Graphs for Data Representation
Different types of graphs, such as line graphs, scatter plots, histograms, box plots, bar graphs, and pie charts, offer diverse ways to represent data effectively. Understanding when to use each type based on the data being collected is essential for insightful analysis. Scatter plots are ideal for
2 views • 37 slides
Exploring Relationships Through Graphs
Learn how to analyze and relate two quantities using graphs, analyze data presented in tables and graphs, and sketch graphs representing various scenarios such as the movement of a model rocket or a playground swing. The visuals provided will help you understand how to interpret and draw graphs in d
2 views • 7 slides
Understanding School Finance: Key Funding Sources and Weighted Funding
Explore the differences in funding between charter schools and traditional ISDs, sources of funding in charter school systems, the impact of attendance on budget allocation, challenges in the Texas school finance system, and the future outlook for charter school funding amidst potential changes. Del
1 views • 90 slides
Effect of Weighted Sled Towing and Weighted Vest on Sprinter Acceleration Performance
Short distance running involves crucial phases affecting sprint performance, with acceleration being particularly important. Training methods like weighted sled towing and weighted vest usage have been found effective in enhancing sprint acceleration. This study investigated the impact of these meth
0 views • 8 slides
Choosing Between Money-Weighted Return & Time-Weighted Return in CFA Level 1 Exam
Learn the differences and implications of Money-Weighted Return (MWRR) and Time-Weighted Return (TWRR) for your CFA Level 1 exam. Understand how to calculate these returns, their characteristics, and when each method is appropriate. Clear your calculator before computations, and remember the key tip
0 views • 12 slides
Understanding Cost Variants in Healthy Diets: Least Cost vs Preference Weighted
The discussion delves into the concept of least-cost versus preference-weighted healthy diets, highlighting the differences in cost and food selection. It explores how preference weighting takes into account food preferences of low-income consumers, providing insights into the affordability and cult
0 views • 18 slides
Understanding Correlation in Scatter Graphs
In this content, various graphs are used to demonstrate the concept of correlation in scatter graphs. It discusses positive, negative, and no correlation, showcasing how one variable affects the other. Examples and explanations are provided to help understand the relationships between different sets
0 views • 17 slides
Symmetric Chromatic Function for Voltage Graphs
Exploring the concept of a Symmetric Chromatic Function (SCF) for voltage graphs involves proper coloring conditions for edges and vertices, edge polarization functions, and decomposing voltage graphs into disconnected and connected squiggly graphs. The SCF allows for determining the number of ways
0 views • 7 slides
Understanding Weighted Average Cost Method in Accounting
The weighted average cost method is a crucial approach in valuing inventory for businesses. It calculates the average cost of all inventory items based on individual costs and quantities held in stock. By dividing the cost of goods available for sale by the number of units available, this method det
0 views • 5 slides
Uniquely Bipancyclic Graphs by Zach Walsh
Research conducted at the University of West Georgia focused on uniquely bipancyclic graphs, defined as bipartite graphs with exactly one cycle of specific lengths determined by the order. Uniquely bipancyclic graphs have special properties, including having a Hamiltonian cycle and a specific order
0 views • 18 slides
Understanding Graphs for Mathematical Interpretation
Explore how students can grasp information through graphical formats and convert it into mathematical graphs. Learn about qualitative graphs, functions, axes, and more. Delve into exercises matching graphs with situations and drawing graphs for given scenarios like plane take-off, biking, and snowbo
0 views • 16 slides
Adjacency Labeling Schemes and Induced-Universal Graphs
Adjacency labeling schemes involve assigning L-bit labels to vertices in a graph for efficient edge determination. The concept of induced-universal graphs is explored, where a graph is universal for a family F if all graphs in F are subgraphs of it. Theorems and lower bounds related to adjacency lab
0 views • 24 slides
Understanding Kinematics Graphs in Physics
Explore the concepts of kinematics graphs through diagrams and descriptions. Learn to interpret distance-time, velocity-time, and speed-time graphs. Understand key parameters such as displacement, initial velocity, final velocity, constant acceleration, and time spent on different parts of a journey
0 views • 33 slides
Graph Modeling in Data Structures and Algorithms
Exploring graph modeling in CSE 373, this lecture covers topics such as using BFS for finding shortest paths, limitations of BFS on weighted graphs, and the introduction of Dijkstra's algorithm for weighted graphs. It emphasizes the importance of considering edge weights in determining traversal ord
0 views • 29 slides
Understanding Graphs and Their Models
Explore the world of graphs through definitions, types, and special features. Learn about vertices, edges, simple and multiple graphs, directed and undirected graphs, and more. Discover the terminology and special types of graphs along with basic concepts and properties.
0 views • 33 slides
Introduction to Graph Theory: Exploring Graphs and Their Properties
This content delves into the realm of graph theory, focusing on the fundamental concepts and applications of graphs. It covers topics such as the Seven Bridges of Königsberg problem, types of graphs, vertex degrees, degree sequences, handshaking theorem, and more. Through visual aids and explanatio
0 views • 71 slides
Understanding Directed Graphs and Adjacency Matrices in Discrete Structures
Explore the concepts of binary relations, directed graphs, adjacency matrices, transitive closure, and walks in the context of discrete structures. Learn how vertices, edges, in-degrees, out-degrees, and self-loops are defined in directed graphs. Understand the importance of adjacency matrices in re
0 views • 28 slides
Understanding Graphs in Mathematics and Computer Science
Graphs in mathematics and computer science are abstract data types used to represent relationships between objects. They consist of vertices connected by edges, which can be directed or undirected. Graphs find applications in various fields like electric circuits, networks, and transportation system
0 views • 19 slides
Understanding Graph Data Structure: Concepts and Examples
Graph data structure is a fundamental tool in computer science, comprising nodes (vertices) connected by edges to represent relationships. This comprehensive guide covers various aspects of graphs, such as definitions, types (undirected, directed, weighted), terminology (adjacent nodes, paths, degre
0 views • 24 slides
Understanding Graphs in Discrete Mathematics
Graphs are fundamental objects in discrete mathematics that model relationships between pairs of objects. This overview covers the vocabulary, formal definitions, and types of graphs, including directed and undirected graphs. Learn about vertices, edges, adjacency, and more essential concepts in gra
0 views • 18 slides
Understanding Dijkstra's Algorithm for Shortest Paths with Weighted Graphs
Dijkstra's Algorithm, named after inventor Edsger Dijkstra, is a fundamental concept in computer science for finding the shortest path in weighted graphs. By growing a set of nodes with computed shortest distances and efficiently using a priority queue, the algorithm adapts BFS to handle edge weight
0 views • 30 slides


