Understanding Expander Families and Ramanujan Graphs
An introduction to expander families and Ramanujan graphs by Tony Shaheen from CSU Los Angeles. The discussion covers the concept of regular graphs, motivation behind expander families, communication networks, and the goal of creating an infinite sequence of d-regular graphs optimized for communicat
0 views • 54 slides
Exploring Product and Knowledge Graphs for Enhanced Information Retrieval
Dive into the world of product and knowledge graphs, uncovering the journey to a rich product graph, examples of knowledge graphs for songs, and the mission to provide comprehensive information on products and related knowledge. Discover use cases ranging from information provision to enhancing sear
3 views • 76 slides
Proposal for Random Access Efficiency Enhancement in IEEE 802.11be Networks
This document presents a proposal for enhancing random access efficiency in IEEE 802.11be networks through a Random-Access NFRP (RA-NFRP) principle. The proposal addresses the challenges of low efficiency in the current UORA procedure and introduces modifications based on the 802.11ax standard to im
5 views • 16 slides
Understanding Bluetooth Low Energy Addresses in IEEE 802.11-21/1535r0
The document explores the features of resolvable addresses in Bluetooth Low Energy (BLE) within the IEEE 802.11-21/1535r0 standard. It discusses the two types of addresses in BLE, Public and Random, and their usage. The emphasis is on Random addresses due to their popularity and privacy features. Th
2 views • 11 slides
Exploring Various Types of Graphs in Statistics Education
Delve into the world of data visualization with slow reveal graphs, column graphs, pictographs, dot plots, divided bar graphs, sector graphs, line graphs, and stem-and-leaf plots. Engage in observations and wonderings to enhance statistical comprehension and analytical skills.
1 views • 8 slides
Exploring Graphs: An Introduction to Data Visualization
This chapter delves into various types of graphs used in data representation, such as bar graphs, pie graphs, histograms, line graphs, and linear graphs. It explains the purpose and structure of each graph type, along with practical examples. Additionally, it covers the Cartesian system for locating
0 views • 15 slides
Understanding Bar Graphs, Double Bar Graphs, and Histograms
Bar graphs are useful for displaying and comparing data, while double bar graphs help compare two related datasets. Histograms show the distribution of data. Learn how to interpret and create these visual representations effectively with examples provided.
0 views • 20 slides
Primal-Dual Algorithms for Node-Weighted Network Design in Planar Graphs
This research explores primal-dual algorithms for node-weighted network design in planar graphs, focusing on feedback vertex set problems, flavors and toppings of FVS, FVS in general graphs, and FVS in planar graphs. The study delves into NP-hard problems, approximation algorithms, and previous rela
0 views • 17 slides
Understanding Random Forests: A Comprehensive Overview
Random Forests, a popular ensemble learning technique, utilize the wisdom of the crowd and diversification to improve prediction accuracy. This method involves building multiple decision trees in randomly selected subspaces of the feature space. By combining the predictions of these trees through a
1 views • 21 slides
Simplifying Random Assignment with The Cambridge Randomizer
The Cambridge Randomizer offers a cost-effective and efficient solution for random assignment in research studies, enabling treatment providers to conduct the process securely. This innovative online portal streamlines the assessment of participant eligibility, provides instant baseline data, and en
0 views • 8 slides
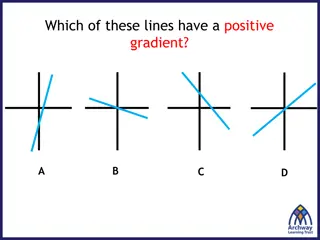
Understanding Graphs of Straight Lines and Equations
Learn how to graph equations and find equations from graphs of straight lines. Explore tables of values, plotting points on a coordinate plane, drawing lines through points, and identifying relationships between graphs and algebraic expressions. Discover the gradient-intercept form of a straight lin
0 views • 14 slides
High-Throughput True Random Number Generation Using QUAC-TRNG
DRAM-based QUAC-TRNG provides high-throughput and low-latency true random number generation by utilizing commodity DRAM devices. By employing Quadruple Row Activation (QUAC), this method outperforms existing TRNGs, achieving a 15.08x improvement in throughput and passing all 15 NIST randomness tests
0 views • 10 slides
Understanding Speed vs. Time Graphs: Analyzing Acceleration and Motion
Explore the concept of speed vs. time graphs and learn how to recognize acceleration, interpret speed, analyze motion, and calculate acceleration from the slope of the graph. Discover the characteristics of graphs showing constant acceleration, varying acceleration, and deceleration. Engage in drawi
0 views • 19 slides
Understanding Random Variables and Their Applications in Various Fields
Random variables play a crucial role in statistics, engineering, and business applications. They can be discrete or continuous, depending on the nature of the outcomes. Discrete random variables have countable values, while continuous random variables can take on any real number. This article explor
0 views • 6 slides
Understanding Random Variables and Probability Distributions
Random variables are variables whose values are unknown and can be discrete or continuous. Probability distributions provide the likelihood of outcomes in a random experiment. Learn how random variables are used in quantifying outcomes and differentiating from algebraic variables. Explore types of r
0 views • 13 slides
Advanced Imputation Methods for Missing Prices in PPI Survey
Explore the innovative techniques for handling missing prices in the Producer Price Index (PPI) survey conducted by the U.S. Bureau of Labor Statistics. The article delves into different imputation methods such as Cell Mean Imputation, Random Forest, Amelia, MICE Predictive Mean Matching, MI Predict
0 views • 22 slides
Representation of Abstract Groups through Graphs
Explore the representation of abstract groups as automorphism groups of graphs, touching on topics such as the existence of graphs whose automorphism groups are isomorphic to given abstract groups, the cardinality of connected graphs satisfying specific properties, and questions regarding the cardin
0 views • 16 slides
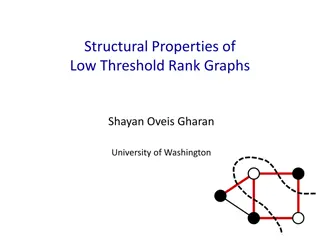
Understanding Low Threshold Rank Graphs and Their Structural Properties
Explore the intriguing world of low threshold rank graphs and their structural properties, including spectral graph theory, Cheeger's inequality, and generalizations to higher eigenvalues. Learn about the concept of threshold rank, partitioning of graphs, diameter limits, and eigenvectors approximat
0 views • 22 slides
Understanding Random Class in Java Programming
The Random class in Java is used to generate pseudo-random numbers. By utilizing methods such as nextInt and nextDouble, you can generate random integers and real numbers within specified ranges. This chapter explores common usage scenarios, such as generating random numbers between specific ranges
2 views • 10 slides
Exploring Types of Graphs for Data Representation
Different types of graphs, such as line graphs, scatter plots, histograms, box plots, bar graphs, and pie charts, offer diverse ways to represent data effectively. Understanding when to use each type based on the data being collected is essential for insightful analysis. Scatter plots are ideal for
2 views • 37 slides
Exploring Relationships Through Graphs
Learn how to analyze and relate two quantities using graphs, analyze data presented in tables and graphs, and sketch graphs representing various scenarios such as the movement of a model rocket or a playground swing. The visuals provided will help you understand how to interpret and draw graphs in d
2 views • 7 slides
Understanding Random Sampling in Probabilistic System Analysis
In the field of statistical inference, random sampling plays a crucial role in drawing conclusions about populations based on representative samples. This lecture by Dr. Erwin Sitompul at President University delves into the concepts of sampling distributions, unbiased sampling procedures, and impor
0 views • 23 slides
Quantum Key Agreements and Random Oracles
This academic paper explores the impossibility of achieving key agreements using quantum random oracles, discussing the challenges and limitations in quantum communication, cryptographic protocols, quantum computation, and classical communication. The study delves into the implications of quantum ra
0 views • 29 slides
Approximate Inference in Bayes Nets: Random vs. Rejection Sampling
Approximate inference methods in Bayes nets, such as random and rejection sampling, utilize Monte Carlo algorithms for stochastic sampling to estimate complex probabilities. Random sampling involves sampling in topological order, while rejection sampling generates samples from hard-to-sample distrib
0 views • 9 slides
Understanding Correlation in Scatter Graphs
In this content, various graphs are used to demonstrate the concept of correlation in scatter graphs. It discusses positive, negative, and no correlation, showcasing how one variable affects the other. Examples and explanations are provided to help understand the relationships between different sets
0 views • 17 slides
Symmetric Chromatic Function for Voltage Graphs
Exploring the concept of a Symmetric Chromatic Function (SCF) for voltage graphs involves proper coloring conditions for edges and vertices, edge polarization functions, and decomposing voltage graphs into disconnected and connected squiggly graphs. The SCF allows for determining the number of ways
0 views • 7 slides
Understanding Random Numbers in Computers
Explore the concept of true random numbers versus pseudorandom numbers in computers. Learn how pseudorandom numbers are generated algorithmically but predictable, while true random numbers are derived from physical phenomena like radioactive decay. Discover the relevance of high-entropy pseudorandom
0 views • 57 slides
Uniquely Bipancyclic Graphs by Zach Walsh
Research conducted at the University of West Georgia focused on uniquely bipancyclic graphs, defined as bipartite graphs with exactly one cycle of specific lengths determined by the order. Uniquely bipancyclic graphs have special properties, including having a Hamiltonian cycle and a specific order
0 views • 18 slides
IEEE 802.11-21/1585r10: Identifiable Random MAC Address Presentation Summary
This presentation discusses the concept of Identifiable Random MAC (IRM) addresses in the IEEE 802.11-21/1585r10 standard. It covers the purpose of IRM addresses in preventing third-party tracking while allowing trusted parties to identify specific devices. The presentation outlines the use of Ident
0 views • 24 slides
Understanding Laplace Transforms for Continuous Random Variables
The Laplace transform is introduced as a generating function for common continuous random variables, complementing the z-transform for discrete ones. By using the Laplace transform, complex evaluations become simplified, making it easy to analyze different types of transforms. The transform of a con
0 views • 17 slides
Analysis of Contagious Sets in Random Graphs
The research delves into the concept of contagious sets in random graphs, focusing on bootstrap percolation, random activation, historical perspectives, recent developments, and NP-hard problems. It explores factors like the size of contagious sets, speed of activation, and open problems in the fiel
0 views • 31 slides
Understanding Graphs for Mathematical Interpretation
Explore how students can grasp information through graphical formats and convert it into mathematical graphs. Learn about qualitative graphs, functions, axes, and more. Delve into exercises matching graphs with situations and drawing graphs for given scenarios like plane take-off, biking, and snowbo
0 views • 16 slides
Understanding Discrete Random Variables and Variance Relationships
Explore the concepts of independence in random variables, shifting variances, and facts about variance in the context of discrete random variables. Learn about key relationships such as Var(X + Y) = Var(X) + Var(Y) and discover common patterns in the Discrete Random Variable Zoo. Embrace the goal of
0 views • 27 slides
GUC-Secure Commitments via Random Oracles: New Findings
Exploring the feasibility of GUC-secure commitments using global random oracles, this research delves into the differences between local and global random oracles, outlining motivations and future work. It discusses UC frameworks, zero-knowledge proofs, oblivious transfers, and the GUC framework for
0 views • 18 slides
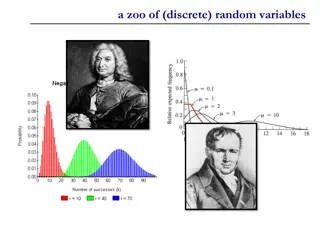
Understanding a Zoo of Discrete Random Variables
Discrete random variables play a crucial role in probability theory and statistics. This content explores three key types: Bernoulli random variable, binomial random variable, and error-correcting codes. From understanding the basics of Bernoulli trials to exploring the application of error correcti
0 views • 27 slides
Understanding Graphs and Their Models
Explore the world of graphs through definitions, types, and special features. Learn about vertices, edges, simple and multiple graphs, directed and undirected graphs, and more. Discover the terminology and special types of graphs along with basic concepts and properties.
0 views • 33 slides
Understanding Random Slopes in Data Analysis
Exploring the impact of grand-mean and group-mean centering on intercept interpretation with random slopes, as well as variations in slope/intercept covariance. Differentiating between fixed and random coefficients, and the effects of adding group mean as a Level 2 variable. Delving into within vs.
0 views • 21 slides
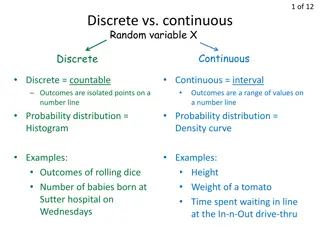
Understanding Random Variables and Mean in Statistics
Random variables can be discrete or continuous, with outcomes represented as isolated points or intervals. The Law of Large Numbers shows how the mean of observed values approaches the population mean as the number of trials increases. Calculating the mean of a random variable involves finding the e
0 views • 13 slides
Understanding Graphs in Mathematics and Computer Science
Graphs in mathematics and computer science are abstract data types used to represent relationships between objects. They consist of vertices connected by edges, which can be directed or undirected. Graphs find applications in various fields like electric circuits, networks, and transportation system
0 views • 19 slides
Density Independent Algorithms for Sparsifying Random Walks
This presentation discusses density-independent algorithms for sparsifying ?-step random walks on graphs, focusing on sparsification by resistances and spectral sparsification. The talk outlines definitions, applications, and results related to the topic. Random walk graphs, transition matrices, Lap
0 views • 20 slides


