Understanding Data Visualization with Matplotlib in Python
Matplotlib is a powerful Python package for data visualization, offering both an integrated interface (pyplot) and a native object-oriented interface. This tool enables users to create various types of plots and gives control over the visualization process. Learn about basic operations, differences
6 views • 19 slides
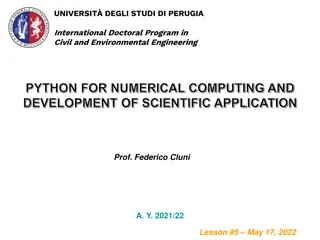
Introduction to Python for Numerical Computing and Scientific Application
This document introduces the use of Python for numerical computing and development of scientific applications in the context of Civil and Environmental Engineering. It covers topics such as utilizing the SciPy ecosystem, creating graphs using pylab/matplotlib, plotting 3D graphs, and working with Pa
0 views • 36 slides
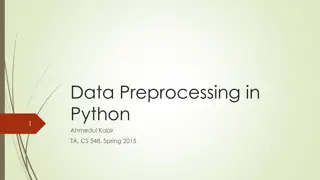
Data Preprocessing Techniques in Python
This article covers various data preprocessing techniques in Python, including standardization, normalization, missing value replacement, resampling, discretization, feature selection, and dimensionality reduction using PCA. It also explores Python packages and tools for data mining, such as Scikit-
0 views • 14 slides


