
Understanding Expander Families and Ramanujan Graphs
An introduction to expander families and Ramanujan graphs by Tony Shaheen from CSU Los Angeles. The discussion covers the concept of regular graphs, motivation behind expander families, communication networks, and the goal of creating an infinite sequence of d-regular graphs optimized for communicat
0 views • 54 slides

Exploring Product and Knowledge Graphs for Enhanced Information Retrieval
Dive into the world of product and knowledge graphs, uncovering the journey to a rich product graph, examples of knowledge graphs for songs, and the mission to provide comprehensive information on products and related knowledge. Discover use cases ranging from information provision to enhancing sear
3 views • 76 slides
VHDL Programming for Sequential Circuits
Explore VHDL programming for sequential circuits including SR Latch, D Latch, SR Flip Flop, JK Flip Flop, and D Flip Flop. Each code snippet is provided along with its corresponding logic and description. Gain insights into designing sequential circuits using VHDL.
13 views • 7 slides

Understanding Binary Counters and Types of Counters
Binary counters are registers used to count clock pulses, while binary counters follow the binary number sequence. There are two types of counters: serial/asynchronous counters and parallel/synchronous counters. Serial counters change output flip-flop to next flip-flop, requiring minimal hardware bu
12 views • 21 slides
Understanding Sequential Logic in NUS CS2100 Lecture #19
Explore the concepts of sequential logic in Lecture #19 by Aaron Tan at NUS, covering memory elements, latches, flip-flops, asynchronous inputs, synchronous sequential circuits, and different types of sequential circuits. Delve into the distinction between combinatorial and sequential circuits, memo
3 views • 26 slides
Physics Clicker Questions and Graphs
Explore a set of physics clicker questions and accompanying graphs covering topics such as ball motion, light refraction, Moon phases, velocity graphs, and integration methods. Test your knowledge and understanding of physics concepts with these engaging questions.
2 views • 17 slides
Understanding D Latches and Flip-Flops in Digital Systems
Digital systems rely on storage elements like D latches and flip-flops to store key information from the past. These structures can hold values of 1 or 0 based on certain control signals, ensuring deterministic behavior. Clock signals are essential for regulating when these storage elements can upda
0 views • 15 slides

Exploring Various Types of Graphs in Statistics Education
Delve into the world of data visualization with slow reveal graphs, column graphs, pictographs, dot plots, divided bar graphs, sector graphs, line graphs, and stem-and-leaf plots. Engage in observations and wonderings to enhance statistical comprehension and analytical skills.
1 views • 8 slides
Understanding Bellman-Ford and Dynamic Programming on Graphs
Exploring Bellman-Ford and Floyd-Warshall algorithms, Dijkstra's Algorithm, shortest path problems, dynamic programming on graphs, and solving distances in a directed acyclic graph. Learn about recurrences, evaluation orders, topological sort, and handling cycles in graphs.
0 views • 39 slides

National 5 Applications of Maths: Charts, Graphs, and Tables Examples
Explore various examples related to reading bar charts, line graphs, stem-and-leaf diagrams, pie charts, and constructing stem-and-leaf charts in the context of National 5 Applications of Maths. Practice interpreting data from tables, line graphs, and stem-and-leaf diagrams to enhance your understan
0 views • 18 slides

Exploring Graphs: An Introduction to Data Visualization
This chapter delves into various types of graphs used in data representation, such as bar graphs, pie graphs, histograms, line graphs, and linear graphs. It explains the purpose and structure of each graph type, along with practical examples. Additionally, it covers the Cartesian system for locating
0 views • 15 slides
Understanding Functions and Graphs in Mathematics
Functions are a fundamental concept in mathematics used to describe relationships in the real world. They can be represented through equations, graphs, tables, or verbal descriptions. A function maps elements from a domain to a range, where each input has a unique output. The domain encompasses all
0 views • 4 slides

Understanding Bar Graphs, Double Bar Graphs, and Histograms
Bar graphs are useful for displaying and comparing data, while double bar graphs help compare two related datasets. Histograms show the distribution of data. Learn how to interpret and create these visual representations effectively with examples provided.
0 views • 20 slides
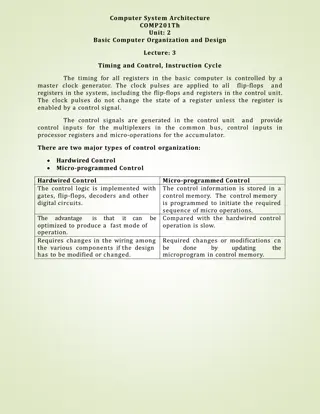
Basic Computer Organization and Design - Timing and Control
The timing of all registers in a basic computer is governed by a master clock generator, with clock pulses controlling the flip-flops and registers in the system. Two main types of control organization are Hardwired Control and Micro-programmed Control. The former uses digital circuitry like gates a
1 views • 4 slides

Primal-Dual Algorithms for Node-Weighted Network Design in Planar Graphs
This research explores primal-dual algorithms for node-weighted network design in planar graphs, focusing on feedback vertex set problems, flavors and toppings of FVS, FVS in general graphs, and FVS in planar graphs. The study delves into NP-hard problems, approximation algorithms, and previous rela
0 views • 17 slides

Understanding Graphs of Straight Lines and Equations
Learn how to graph equations and find equations from graphs of straight lines. Explore tables of values, plotting points on a coordinate plane, drawing lines through points, and identifying relationships between graphs and algebraic expressions. Discover the gradient-intercept form of a straight lin
0 views • 14 slides
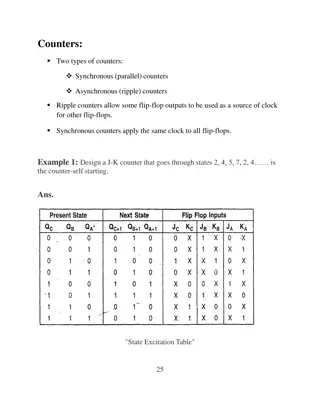
Understanding Synchronous and Asynchronous Counters in Digital Electronics
Explore the concepts of synchronous (parallel) and asynchronous (ripple) counters in digital electronics, where ripple counters enable clock sharing among flip-flops and synchronous counters apply the same clock to all. Learn to design J-K and up-down counters using flip-flops with examples and stat
1 views • 4 slides

Understanding Speed vs. Time Graphs: Analyzing Acceleration and Motion
Explore the concept of speed vs. time graphs and learn how to recognize acceleration, interpret speed, analyze motion, and calculate acceleration from the slope of the graph. Discover the characteristics of graphs showing constant acceleration, varying acceleration, and deceleration. Engage in drawi
0 views • 19 slides
Understanding Counters in Sequential Circuits
Counters in sequential circuits are crucial components used for counting clock cycles and measuring time intervals. They are composed of flip-flops that progress through a sequence of states based on clock pulses. This sequential circuit has no inputs other than the clock pulse and relies on its int
1 views • 22 slides
Understanding Flip-Flop Timing Parameters in Digital Systems
In digital systems, flip-flop timing parameters are crucial for proper operation. Synchronous inputs must remain stable before and after the clock edge to ensure correct storage of values. Clock frequency, setup time, hold time, and propagation delay play key roles in signal integrity. By considerin
0 views • 9 slides

Understanding Sequential Counters in Digital Circuits
Sequential counters, comprised of flip-flops, are essential in digital circuits for counting clock cycles. They advance through states based on clock pulses and can measure time intervals. The circuit's output state solely depends on its present state, with transitions occurring at each clock pulse.
0 views • 22 slides

Representation of Abstract Groups through Graphs
Explore the representation of abstract groups as automorphism groups of graphs, touching on topics such as the existence of graphs whose automorphism groups are isomorphic to given abstract groups, the cardinality of connected graphs satisfying specific properties, and questions regarding the cardin
0 views • 16 slides
Understanding Low Threshold Rank Graphs and Their Structural Properties
Explore the intriguing world of low threshold rank graphs and their structural properties, including spectral graph theory, Cheeger's inequality, and generalizations to higher eigenvalues. Learn about the concept of threshold rank, partitioning of graphs, diameter limits, and eigenvectors approximat
0 views • 22 slides

Exploring Types of Graphs for Data Representation
Different types of graphs, such as line graphs, scatter plots, histograms, box plots, bar graphs, and pie charts, offer diverse ways to represent data effectively. Understanding when to use each type based on the data being collected is essential for insightful analysis. Scatter plots are ideal for
2 views • 37 slides

Exploring Relationships Through Graphs
Learn how to analyze and relate two quantities using graphs, analyze data presented in tables and graphs, and sketch graphs representing various scenarios such as the movement of a model rocket or a playground swing. The visuals provided will help you understand how to interpret and draw graphs in d
2 views • 7 slides

Understanding Correlation in Scatter Graphs
In this content, various graphs are used to demonstrate the concept of correlation in scatter graphs. It discusses positive, negative, and no correlation, showcasing how one variable affects the other. Examples and explanations are provided to help understand the relationships between different sets
0 views • 17 slides

Symmetric Chromatic Function for Voltage Graphs
Exploring the concept of a Symmetric Chromatic Function (SCF) for voltage graphs involves proper coloring conditions for edges and vertices, edge polarization functions, and decomposing voltage graphs into disconnected and connected squiggly graphs. The SCF allows for determining the number of ways
0 views • 7 slides

Uniquely Bipancyclic Graphs by Zach Walsh
Research conducted at the University of West Georgia focused on uniquely bipancyclic graphs, defined as bipartite graphs with exactly one cycle of specific lengths determined by the order. Uniquely bipancyclic graphs have special properties, including having a Hamiltonian cycle and a specific order
0 views • 18 slides

Understanding Graphs for Mathematical Interpretation
Explore how students can grasp information through graphical formats and convert it into mathematical graphs. Learn about qualitative graphs, functions, axes, and more. Delve into exercises matching graphs with situations and drawing graphs for given scenarios like plane take-off, biking, and snowbo
0 views • 16 slides

Adjacency Labeling Schemes and Induced-Universal Graphs
Adjacency labeling schemes involve assigning L-bit labels to vertices in a graph for efficient edge determination. The concept of induced-universal graphs is explored, where a graph is universal for a family F if all graphs in F are subgraphs of it. Theorems and lower bounds related to adjacency lab
0 views • 24 slides

Enhancing Student Engagement with Flip in Asynchronous Online Classes
Explore the use of Flip for student engagement in asynchronous online classes through real student feedback and examples. Learn how Flip encourages interaction and collaboration, making online learning more dynamic and engaging for students. Discover various ways to use Flip for assignments, discuss
0 views • 15 slides
Understanding Kinematics Graphs in Physics
Explore the concepts of kinematics graphs through diagrams and descriptions. Learn to interpret distance-time, velocity-time, and speed-time graphs. Understand key parameters such as displacement, initial velocity, final velocity, constant acceleration, and time spent on different parts of a journey
0 views • 33 slides

Rectangular Dissections and Edge-Flip Chains in Lattice Triangulations
Explore equitable rectangular dissections and their applications in VLSI layout, graph mapping, and combinatorial problems in this scholarly work by Dana Randall from Georgia Institute of Technology. Discover the concept of partitioning an n x n lattice region into n2/a rectangles or areas where cor
0 views • 32 slides
Understanding Graphs and Their Models
Explore the world of graphs through definitions, types, and special features. Learn about vertices, edges, simple and multiple graphs, directed and undirected graphs, and more. Discover the terminology and special types of graphs along with basic concepts and properties.
0 views • 33 slides
Introduction to Graph Theory: Exploring Graphs and Their Properties
This content delves into the realm of graph theory, focusing on the fundamental concepts and applications of graphs. It covers topics such as the Seven Bridges of Königsberg problem, types of graphs, vertex degrees, degree sequences, handshaking theorem, and more. Through visual aids and explanatio
0 views • 71 slides
Rainbow Cycles in Flip Graphs and Associahedra: Combinatorial Study
Exploring rainbow cycles and associated properties in the context of flip graphs and triangulations, this study delves into the diameter, realiability, automorphism group, and more of the associahedron. Motivated by binary reflected Gray codes, the research aims to find balanced Gray codes for vario
0 views • 23 slides
Flip The Museum: Extending Audience Engagement with Gamification
The project 'Flip The Museum' aims to revolutionize museum experiences by waking up visitors with interactive content. Through a mobile and web-based platform, teachers and curators can customize the museum journey for visitors, making it both educational and fun. The platform utilizes gamification
0 views • 11 slides
Understanding Directed Graphs and Adjacency Matrices in Discrete Structures
Explore the concepts of binary relations, directed graphs, adjacency matrices, transitive closure, and walks in the context of discrete structures. Learn how vertices, edges, in-degrees, out-degrees, and self-loops are defined in directed graphs. Understand the importance of adjacency matrices in re
0 views • 28 slides
Understanding Graphs in Mathematics and Computer Science
Graphs in mathematics and computer science are abstract data types used to represent relationships between objects. They consist of vertices connected by edges, which can be directed or undirected. Graphs find applications in various fields like electric circuits, networks, and transportation system
0 views • 19 slides

Understanding Graphs in Discrete Mathematics
Graphs are fundamental objects in discrete mathematics that model relationships between pairs of objects. This overview covers the vocabulary, formal definitions, and types of graphs, including directed and undirected graphs. Learn about vertices, edges, adjacency, and more essential concepts in gra
0 views • 18 slides