Immigrant Contributions to the New York State and City Economies
Immigrants play a significant role in the economies of New York State and City, contributing nearly one-quarter and nearly half of their respective economic outputs. They represent a substantial share of the working-age population, labor force, and GDP. Immigrants work across various job sectors, from managerial and professional roles to blue-collar jobs, showcasing their diverse contributions to the economic landscape.

Download Presentation

Please find below an Image/Link to download the presentation.
The content on the website is provided AS IS for your information and personal use only. It may not be sold, licensed, or shared on other websites without obtaining consent from the author. Download presentation by click this link. If you encounter any issues during the download, it is possible that the publisher has removed the file from their server.
E N D
Presentation Transcript
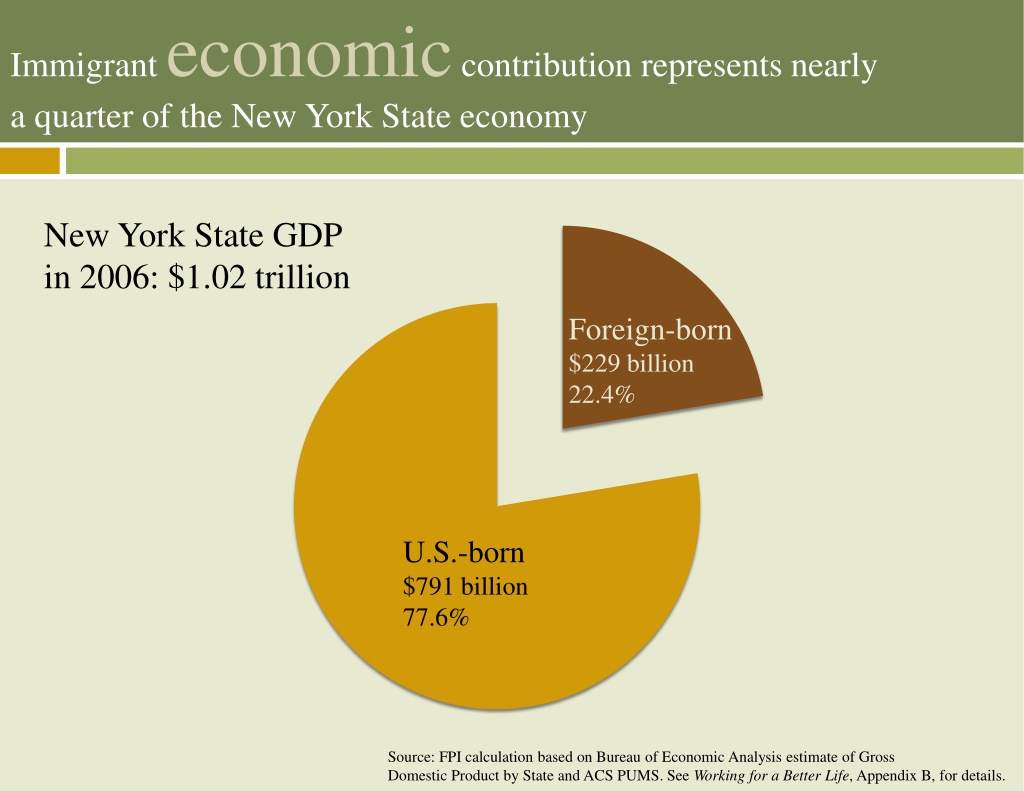
Immigrant economic contribution represents nearly a quarter of the New York State economy New York State GDP in 2006: $1.02 trillion Foreign-born $229 billion 22.4% U.S.-born $791 billion 77.6% Source: FPI calculation based on Bureau of Economic Analysis estimate of Gross Domestic Product by State and ACS PUMS. See Working for a Better Life, Appendix B, for details.
New York State Immigration and growth go hand in hand Map created by the Regional Plan Association. Source: FPI analysis of 2000 Census microdata. Rochester Hudson Valley Ithaca Downstate Suburbs New York City
Immigrant share of population is in line with immigrant share of economic output Immigrant share of population 21% Immigrant share of working-age population 26% Immigrant share of labor force 26% Immigrant share of GDPS for New York 22% 0% 5% 10% 15% 20% 25% 30% Source: Fiscal Policy Institute: Working for a Better Life.
Immigrant contributions make up almost half of the New York City economy Working age is 16-64 years old. Sources: FPI analysis of ACS PUMS, and New York City Department of City Planning. Immigrant share of population 37% Immigrant share of working-age population 45% Immigrant share of labor force 46% Immigrant share of wage & salary 37% income 0% 5% 10% 15% 20% 25% 30% 35% 40% 45% 50%
Managerial & professional Tech, sales, & admin. support Immigrants work in jobs across the spectrumof Service jobs the NYC economy Blue-collar jobs Source: Fiscal Policy Institute analysis of 2005-07 American Community Survey.
Managerial & professional Dominican-born Tech, sales, & admin. support immigrants in New York City Service jobs Blue-collar jobs Source: Fiscal Policy Institute analysis of 2005-07 American Community Survey.
Managerial & professional Mexican-born Tech, sales, & admin. support immigrants in New York City Service jobs Blue-collar jobs Source: Fiscal Policy Institute analysis of 2005-07 American Community Survey.
Managerial & professional Korean-born Tech, sales, & admin. support immigrants in New York City Service jobs Blue-collar jobs Source: Fiscal Policy Institute analysis of 2005-07 American Community Survey.
Managerial & professional Russian-born Tech, sales, & admin. support immigrants in New York City Service jobs Blue-collar jobs Source: Fiscal Policy Institute analysis of 2005-07 American Community Survey.
Managerial & professional Trinidad & Tech, sales, & admin. support Tobago-born immigrants in New York City Service jobs Blue-collar jobs Source: Fiscal Policy Institute analysis of 2005-07 American Community Survey.
blue-collar, service, and all other combined white-collar Dominican Republic 33% 67% China 46% 54% Mexico 20% 80% Jamaica 46% 54% Guyana 51% 49% Ecuador 25% 75% Different groups of immigrants are concentrated in different occupations Haiti 43% 57% Trinidad and Tobago 51% 49% India 70% 30% Colombia 40% 60% Other USSR/Russia 67% 33% Korea 73% 27% Philippines 71% 29% Poland 40% 60% Ukraine 60% 40% Bangladesh 53% 47% Peru 41% 59% Italy 55% 45% Hong Kong 78% 22% Pakistan 49% 51% All Immigrants 49% 51% Source: Fiscal Policy Institute analysis of 2005-07 American Community Survey. All US Born 74% 26% 0% 25% 50% 75% 100% White-collar jobs Service and blue-collar jobs
Share of total income accruing to the top one percent of tax filers 50% 45% 40% 35% 30% 25% 20% 15% 10% 5% 0% 1929 1938 1995 1914 1917 1920 1923 1926 1932 1935 1941 1944 1947 1950 1953 1956 1959 1962 1965 1968 1971 1974 1977 1980 1983 1986 1989 1992 1998 2001 2004 2007
Share of total income accruing to the top one percent of tax filers 50% 45% 40% 35% 30% 25% 20% 15% United States 10% 5% 0% 1929 1938 1995 1914 1917 1920 1923 1926 1932 1935 1941 1944 1947 1950 1953 1956 1959 1962 1965 1968 1971 1974 1977 1980 1983 1986 1989 1992 1998 2001 2004 2007
Share of total income accruing to the top one percent of tax filers 50% 45% 40% 35% 30% 25% 20% 15% United States 10% 5% 0% 1929 1938 1995 1914 1917 1920 1923 1926 1932 1935 1941 1944 1947 1950 1953 1956 1959 1962 1965 1968 1971 1974 1977 1980 1983 1986 1989 1992 1998 2001 2004 2007
Share of total income accruing to the top one percent of tax filers 50% 45% 40% 35% 30% 25% 20% 15% United States 10% 5% 0% 1929 1938 1995 1914 1917 1920 1923 1926 1932 1935 1941 1944 1947 1950 1953 1956 1959 1962 1965 1968 1971 1974 1977 1980 1983 1986 1989 1992 1998 2001 2004 2007
Share of total income accruing to the top one percent of tax filers 50% 45% 40% 35% 30% 25% 20% 15% United States New York State 10% 5% 0% 1929 1938 1995 1914 1917 1920 1923 1926 1932 1935 1941 1944 1947 1950 1953 1956 1959 1962 1965 1968 1971 1974 1977 1980 1983 1986 1989 1992 1998 2001 2004 2007
Share of total income accruing to the top one percent of tax filers 50% 45% 40% 35% 30% New York City 25% 20% 15% United States New York State 10% 5% 0% 1929 1938 1995 1914 1917 1920 1923 1926 1932 1935 1941 1944 1947 1950 1953 1956 1959 1962 1965 1968 1971 1974 1977 1980 1983 1986 1989 1992 1998 2001 2004 2007
Immigrants have slightly lower poverty rates, but poverty levels are appallingly high for all, with great discrepancy between race/ethnic groups 35% U.S.-born Foreign-born 30% 25% 20% Source: FPI analysis of 2005-07 ACS. 15% 10% 5% 0% Overall White Black Latino Asian even before the recent economic downturn. And rates are even higher in upstate cities.
300,000 more low-wage jobs in 2007 than in 1990, with immigrants more likely to be in low-wage jobs, and again big race/ethnic disparities Share of full-time workers in low-wage jobs Low wage = 2/3 of median ($27,000) 2005-07 60% U.S.-born Foreign-born 50% 28 percent of all full-time workers are in low-wage jobs 40% Source: FPI analysis of 2005-07 ACS. 30% 20% 10% 0% Overall White Black Latino Asian
There are also widespread labor law violations that are more prevalent among immigrants but also very common for minorities (including U.S.- born) and not trivial for whites In NY, Chicago, and Los Angeles, among low-wage workers: * 31 percent of workers subjected to legal violations * 26 percent of legal immigrants * 38 percent of undocumented immigrants * 30 percent of blacks (most of them U.S.-born) * 10 percent of whites (mostly U.S.-born) Broken Laws, Unprotected Workers, Annette Bernhardt et al.