HIV Trends in Asia and the Pacific: Update 2019
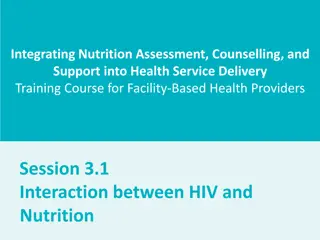
The AIDS update for Asia and the Pacific region in 2019 reveals concerning statistics on new HIV infections, with a focus on young people and men who have sex with men. The data showcases regional profiles, prevalence rates, and incidence trends, shedding light on the challenges in combating HIV/AIDS in this diverse and dynamic area. From the proportion of young people affected to the number of new infections and AIDS-related deaths, the report highlights the urgent need for targeted interventions and awareness programs to address the growing epidemic in these regions.

Download Presentation

Please find below an Image/Link to download the presentation.
The content on the website is provided AS IS for your information and personal use only. It may not be sold, licensed, or shared on other websites without obtaining consent from the author. Download presentation by click this link. If you encounter any issues during the download, it is possible that the publisher has removed the file from their server.
E N D
Presentation Transcript
GLOBAL AIDS UPDATE 2019 REGION PROFILES ASIA AND THE PACIFIC
Proportion of young people among total estimated new HIV infections, Asia and the Pacific, 2018 69% Philippines Note: Pink bars are above the regional average. Blue bars are below the regional average. Myanmar Indonesia Thailand Lao People s Democratic Republic Malaysia 26% ASIA AND THE PACIFIC Papua New Guinea Nepal Cambodia Pakistan Sri Lanka Bhutan Mongolia Afghanistan Viet Nam 13% Bangladesh 0 50 Per cent Source: Prepared by www.aidsdatahub.org, based on UNAIDS 2019 HIV estimates.
Rising HIV prevalence and high HIV incidence among young men who have sex with men, selected countries, Asia and the Pacific, 2011 2017 INDONESIA MALAYSIA HIV prevalence among young men who have sex with men (<25 years) 25 18 20 14 Per cent Per cent 2.5x 15 4x 9 10 5 5 0 0 2011 2015 2014 2017 CHINA THAILAND Bangkok**, 2006 2014 HIV incidence among young men who have sex with men (<25 years) Seven Chinese cities*, 2012 2013 14 10 per 100 person years 11.8 per 100 person years 7.7 HIV incidence 7.2 HIV incidence 7.6 7 5 0 0 Younger than 25 years 25 years or older 18 21 years 22 24 years *Changsha, Ji nan, Kunming, Nanjing, Shanghai, Shenyang and Zhengzhou. **Bangkok Men Who have Sex with Men Cohort Study (BMCS). Source: Prepared by www.aidsdatahub.org, based on integrated biological and behavioural surveys; Mao X, Wang Z, Hu Q, Huang C, Yan H, Wang Z et al. HIV incidence is rapidly increasing with age among young men who have sex with men in China: a multicentre cross-sectional survey. HIV Med. 2018;19(8):513-22; and Thienkrua W, van Griensven F, Mock PA, Dunne EF, Raengsakulrach B, Wimonsate W et al. Young men who have sex with men at high risk for HIV, Bangkok MSM Cohort Study, Thailand 2006-2014. AIDS Behav. 2018;22(7):2137-46.
Number of new HIV infections and AIDS-related deaths, and incidence-prevalence ratio Asia and the Pacific, 2000 2018 New HIV infections AIDS-related deaths Incidence-prevalence ratio 16 700 000 500 000 450 000 400 000 Percentage change in new HIV infections since 2010 -9% Percentage change in AIDS- related deaths since 2010 -24% 2018 Number of AIDS-related deaths Number of new HIV infections 14 600 000 Incidence- prevalence Incidence-prevalence ratio 12 500 000 350 000 300 000 ratio 10 400 000 5.4% [4.5 6.5%] 8 250 000 300 000 200 000 150 000 6 200 000 4 100 000 50 000 3 2 100 000 0 0 0 2000 2010 2018 2000 2010 2018 2000 2005 2010 2015 2018 New HIV infections AIDS-related deaths Incidence-prevalence ratio Target value Source: UNAIDS 2019 estimates.
Percentage change in new HIV infections, by country, Asia and the Pacific, 2010 2018 250 203 200 150 100 Per cent 57 56 49 50 26 8 4 0 -8 -12 -27 -28 -28 -31 -50 -43 -52 -57 -59 -62 -64 -66 -100 Nepal Mongolia Afghanistan Bhutan Bangladesh Japan Australia Malaysia New Zealand Sri Lanka Pakistan Myanmar Cambodia Thailand Indonesia Singapore Papua New Guinea Philippines Viet Nam Lao People s Democratic Republic Source: UNAIDS 2019 estimates.
HIV prevalence among key populations Distribution of new HIV infections (aged 15 49 years), by population group Asia and the Pacific, 2014 2018 Asia and the Pacific, 2018 35 Sexworkers 8% 30 Remaining population 22% Peoplewho inject drugs 13% 25 Per cent 20 15 12.3 10 Gay men and other men who have sex with men 30% Clients of sex workers and sex partners of other key populations 25% 5 4.9 0.7 3.1 1.0 0 Transgender women 2% Sex workers, n = 211 Gay men and other men who have sex with men, n = 21 People who inject drugs, n = 16 Transgender people, n = 13 Prisoners, n = 10 Source: UNAIDS Global AIDS Monitoring, 2014 2018. Source: UNAIDS special analysis, 2019.
Estimated size of key populations, Asia and the Pacific, 2018 Country National adult population (15+) Sex workers Sex workers as per cent of adult population (15+) Gay men and other men who have sex with men Gay men and other men who have sex with men as per cent of adult population (15+) People who inject drugs People who inject drugs as per cent of adult population (15+) Transgender people Transgender people as per cent of adult population (15+) Prisoners Prisoners as per cent of adult population (15+) Lao People's Democratic Republic 4 695000 14000 0.30 17000 0.36 Malaysia 24 340000 37000 0.15 75000 0.31 Nepal 20 684000 22000 0.11 New Zealand 3 808000 15000 0.39 10000 0.26 Singapore 4 938000 11000 0.23 SriLanka 15 980000 30000 0.19 74000 0.46 2700 0.02 2200 0.01 Thailand 57 425000 370000 0.64 Viet Nam 74 266000 190000 0.26 National population size estimate Local population size estimate Insufficient data No data Source: Global AIDS Monitoring, 2018; United Nations, Department of Economic and Social Affairs, Population Division. World population prospects: the 2017 revision. 2018 (custom data acquired via website).
HIV testing and treatment cascade, Asia and the Pacific, 2018 7 6 Gap to reaching the first 90: 1.2 million 5 Gap to reaching the first and second 90s: 1.6 million Gap to reaching all three 90s: 1.4 million 4 Number of people living with HIV (million) 3 69% [59 85%] 54% [41 68%] 2 49% [38 63%] 1 0 People living with HIV who know their status People living with HIV on treatment People living with HIV who are virally suppressed Source: UNAIDS special analysis, 2019; see annex on methods for more details.
909090 country scorecard: Asia and the Pacific, 2018 (1/2) First 90: percentage of people living with HIV who know their HIV status Second 90: percentage of people living with HIV who know their status and who are on treatment Third 90: percentage of people living with HIV on treatment who have suppressed viral loads Viral load suppression: percentage of people living with HIV who are virally suppressed All ages Women (15 years and older) Men All ages Women (15 years and older) Men All ages Women (15 years and older) Men All ages Women (15 years and older) Men (15 years and older) (15 years and older) (15 years and older) (15 years and older) Asia and the Pacific 69 74 66 78 81 76 91 92 91 49 55 46 Afghanistan Australia Bangladesh Bhutan Brunei Darussalam Cambodia China Cook Islands Democratic People'sRepublic of Korea Fiji India Indonesia Japan Kiribati Lao People s DemocraticRepublic Malaysia Maldives Marshall Islands Micronesia (Federated Statesof) Mongolia 38 32 40 34 38 32 95 >95 95 79 81 78 37 47 35 73 37 35 60 79 93 60 78 61 75 91 >95 >95 86 59 95 94 57 59 82 82 80 >95 83 >95 83 >95 94 >95 94 78 79 76 51 33 >95 64 55 >95 >95 85 86 87 92 82 47 52 44 75 89 95 48 38 39 38 86 77 89 79 91 77 26 27 26 90 90 90: Viral load suppression: 90% and above 85 89% 70 84% 50 69% Less than 50% 73% and above 65 72% 40 64% 25 39% Less than 25% Source: UNAIDS special analysis, 2019.
909090 country scorecard: Asia and the Pacific, 2018 (2/2) First 90: percentage of people living with HIV who know their HIV status Second 90: percentage of people living with HIV who know their status and who are on treatment Third 90: percentage of people living with HIV on treatment who have suppressed viral loads Viral load suppression: percentage of people living with HIV who are virally suppressed All ages Women (15 years and older) Men All ages Women (15 years and older) Men All ages Women (15 years and older) Men All ages Women (15 years and older) Men (15 years and older) (15 years and older) (15 years and older) (15 years and older) Asia and the Pacific 69 74 66 78 81 76 91 92 91 49 55 46 Myanmar Nauru Nepal New Zealand Niue Pakistan Palau Papua New Guinea Philippines Republic of Korea Samoa Singapore Solomon Islands Sri Lanka Thailand Timor-Leste Tonga Tuvalu Vanuatu Viet Nam 92 92 92 65 75 58 71 71 70 79 93 68 14 8 16 69 83 66 87 76 91 78 87 77 75 57 77 28 70 59 >95 >95 >95 31 33 38 >95 >95 >95 77 84 78 87 75 83 >95 38 73 39 75 37 71 94 94 94 80 82 78 >95 >95 90 90 90: Viral load suppression: 90% and above 85 89% 70 84% 50 69% Less than 50% 73% and above 65 72% 40 64% 25 39% Less than 25% Source: UNAIDS special analysis, 2019.
Viral load suppression among adults (15 years and older) living with HIV, by sex, Asia and the Pacific, 2018 100 90 80 70 60 Per cent 50 40 30 20 10 0 Australia Cambodia Mongolia Myanmar Sri Lanka Thailand Lao People s Democratic Republic Females Males Source: UNAIDS special analysis, 2019.
Knowledge of status among key populations, Asia and the Pacific, 2016 2018 100 90 80 70 60 Per cent 50 40 30 20 10 0 Australia Bangladesh Fiji India Lao Malaysia Mongolia Myanmar Nepal Pakistan Papua New Guinea Philippines Sri Lanka Thailand Viet Nam People s Democratic Republic Sex workers Gay men and other men who have sex with men People who inject drugs Transgender people Note: Data shown come from surveys, which are typically conducted in areas with high prevalence and needs and may not be nationally representative. Source: Global AIDS Monitoring, 2016 2018.
Percentage of key populations who reported receiving at least two prevention services in the past three months, Asia and the Pacific, 2016 2018 100 90 80 70 60 Per cent 50 40 30 20 10 0 Bangladesh Cambodia* Lao Malaysia Myanmar Nepal* Pakistan Philippines Sri Lanka Thailand Viet Nam People s Democratic Republic Sex workers Gay men and other men who have sex with men People who inject drugs Transgender people Note 1: The use of an asterisk (*) indicates that data for marked countries come from programme data (which tend to show higher values due to the use as a denominator of the number of key population members that are linked to the programme) and not from a survey. Note 2: Possible prevention services received among sex workers, gay men and other men who have sex with men and transgender people: condoms and lubricant, counselling on condom use and safe sex, and testing of STIs. Possible prevention services received among people who inject drugs: condoms and lubricant, counselling on condom use and safe sex, and clean needles or syringes. Source: Global AIDS Monitoring, 2016 2018.
Prevention coverage among transgender people, selected countries with available data, Asia and the Pacific, 2015 2018 Given condoms and lubricants 100 Received counselling on condom use and safe sex Tested for STI Prevention coverage Bangladesh (2015) Cambodia (2018) Malaysia (2017) Pakistan (2016) Thailand (2018) Per cent 50 0 Source: Prepared by www.aidsdatahub.org, based on 2018 and 2019 Global AIDS Monitoring.
Percentage of total adult HIV infections that are among gay men and other men who have sex with men, availability of PrEP, selected countries, Asia and the Pacific, 2018 100 90 80 70 60 Per cent 50 40 30 20 10 0 Bangladesh Myanmar Cambodia Vietnam Nepal Lao Indonesia Pakistan Sri Lanka Thailand Mongolia Malaysia Philippines People s Democratic Republic PrEP national/large-scale PrEP pilot/demonstration Planned PrEP pilot/demonstration No PrEP programme Note: Data do not include drug registration and private sector availability. Antiretroviral medicines registered for use as PrEP are available in the private sector in several countries, including Malaysia, the Philippines, Thailand and Viet Nam. China and India are not included in the above graph since disaggregated new HIV infection data for gay men and other men who have sex with men are not available. India has completed a PrEP demonstration project, and China has a current demonstration project. Source: Prepared by www.aidsdatahub.org based on country-submitted AEM Spectrum HIV estimates files and information from national programmes.
Needle and syringe programme (NSP) and opioid substitution therapy (OST) coverage among people who inject drugs, selected countries with available data, Asia and the Pacific, 2018 500 100 457 Needle syringes per person 400 80 74 366 who injects drugs/year 351 OST coverage (%) 300 60 233 200 40 28 126 117 22 20 17 84 100 20 11 52 46 5 18 3 3 3 10 3 0 0 Cambodia* India Myanmar New Zealand Bangladesh Viet Nam Nepal Afghanistan Pakistan Malaysia Thailand Indonesia OST coverage (%) High coverage: >40% Medium coverage: 20 40% Low coverage: <20% NSP coverage (needle syringes per person who injects drugs per year) High coverage: >200 Medium coverage: >100 <200 Low coverage: <100 *2016 data for OST coverage Source: Prepared by www.aidsdatahub.org, based on 2019 Global AIDS Monitoring.
Percentage of men and women aged 1549 years with discriminatory attitudes towards people living with HIV, Asia and the Pacific, 2013 2017 80 70 60 50 Per cent 40 30 20 10 0 Mongolia Myanmar Philippines Afghanistan Timor- Pakistan Lao Bangladesh Nepal Viet Nam India Thailand Cambodia Leste People s Democratic Republic People who would not buy vegetables from a shopkeeper living with HIV People who think children living with HIV should not be allowed to attend school with children not living with HIV Note: Data for Bangladesh, the Philippines and Viet Nam are for female respondents only. Source: Population-based surveys, 2013 2017, countries with available data.
Percentage of ever-married or partnered women aged 1549 years who experienced physical and/or sexual violence by an intimate partner in the past 12 months, Asia and the Pacific, most recent data, 2014 2018 50 45 40 35 30 Per cent 25 20 15 10 5 0 Nauru Afghanistan Timor-Leste Bangladesh India Marshall Islands Pakistan Nepal Myanmar Cambodia Philippines Source: Population-based surveys, 2014 2018.
Stigma and discrimination in health-care settings experienced by people living with HIV in the past 12 months, Thailand, 2014 2015 and 2017 0 10 20 30 40 50 Decided not to go to health facility because 24.2 34.9 of internalized stigma Experienced stigma and discrimination in a 12.1 11.1 health-care setting Avoided (or) delayed health care because of fear of stigma and discrimination 13 5.2 Experienced HIV disclosure and non- confidentiality in a health-care facility 10.3 24.5 2.2 Was advised to undergo/experienced coerced termination of pregnancy and sterilization 5 2014 2015 2017 Source: Stigma and discrimination among health care providers and people living with HIV in health care settings in Thailand: comparison of findings from 2014 2015 and 2017. Bangkok: Ministry of Public Health [Thailand]; Oct 2018.
Cascade of services for preventing vertical transmission, numbers of new HIV infections and transmission rate, Asia and the Pacific, 2018 70 000 60 000 50 000 56% [47 71%] 40 000 Number 34% [27 40%] 30 000 Transmission rate: 21%[19 24%] 20 000 10 000 0 Births to women living with HIV Women receiving antiretrovirals to prevent vertical transmission Infants tested by eight weeks of age New child infections Any birth to women living with HIV Children newly infected with HIV Source: UNAIDS 2019 estimates; 2019 Global AIDS Monitoring.
HIV resource availability, by source, Asia and the Pacific, 2010 2018, and projected resource needs by 2020 6000 5000 4000 US$ (million) Domestic (public and private) United States (bilateral) Global Fund Other international Resource needs (Fast-Track) 3000 2000 1000 0 2010 2011 2012 2013 2014 2015 2016 2017 2018 2020 Source: UNAIDS 2019 resource availability and needs estimates.


")


 and opioid substitution")