Engagement vs. Efficacy: Impact of Social Media on Information Sharing
The presentation by Travis Hoppe at the National Center for Health Statistics explores the question: Can engagement on social media serve as a substitute for efficacy? It discusses the importance of engagement on platforms like Twitter, measuring impact, and characteristics of effective communication. Emphasizing the need to leverage social media for transparency and collaboration, it also addresses the influence of these platforms on news consumption and strategies to combat misinformation.
Download Presentation

Please find below an Image/Link to download the presentation.
The content on the website is provided AS IS for your information and personal use only. It may not be sold, licensed, or shared on other websites without obtaining consent from the author. Download presentation by click this link. If you encounter any issues during the download, it is possible that the publisher has removed the file from their server.
E N D
Presentation Transcript
NATIONAL CENTER FOR HEALTH STATISTICS Short communication as a medium: Is engagement a substitute for efficacy? Travis Hoppe, PhD Chief Data Scientist National Center for Health Statistics Federal Committee on Statistical Methodology (FCSM) Research and Policy conference November 3rd, 2021 The findings and conclusions in this presentation are those of the authors and do not necessarily represent the official position of the National Center for Health Statistics or the Centers for Disease Control and Prevention.
Outline Importance of engagement on social media Measuring impact (by proxy) Characteristics of an effective communication on Twitter
Acknowledgments Saarika Virkar Florence Lee ORISE Fellow Health Statistician NCHS Division of Research Methodology NCHS Division of Analysis and Epidemiology
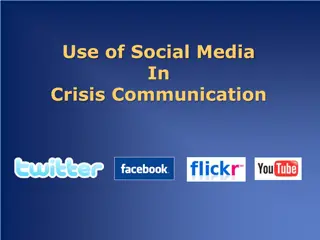
Why engage on social media? Federal mandates and recommendations engage the public in using public data assets of the agency and encourage collaboration [1] Government should be transparent & participatory [2] Social media networks as communication tools Majority of Americans receive news sometimes or often on social media [3] More users seek news on Twitter than other social media networks [3] [1] Open, Public, Electronic, and Necessary Government Data Act. 44 USC 101, Section II (Evidence Act) [2] Memorandum on Transparency and Open Government (Administration of President Obama) [3] https://www.pewresearch.org/journalism/2021/01/12/news-use-across-social-media-platforms-in-2020/
Influence of social media on news consumption https://www.pewresearch.org/journalism/2021/01/12/news-use-across-social-media-platforms-in-2020/
Amplify authoritative voices to combat misinformation Nearly 70% of engagement with COVID-19 misinformation came from politicians, celebrities, or other prominent public figures [1] Users tend to connect to like-minded users and follow influencers who present as information hubs Users tend to believe and share (mis)information posted by influencers (Mis)information is shared in a homophilic social network [2] Falsehood diffused farther, faster, deeper, and more broadly False news was 70% more likely to be retweeted than the truth [3] [1] Brennen, J & Simon, Felix & Howard, Philip & Nielsen, Rasmus. (2020). Types, Sources, and Claims of COVID-19 Misinformation. [2] Xu, W., Sasahara, K. (2021) Characterizing the roles of bots on Twitter during the COVID-19 infodemic. J Comput Soc Sc [3] Vosoughi, S., Roy, D., & Aral, S. (2018). The spread of true and false news online. Science, 359(6380), 1146-1151.
Federal statistical agencies on Twitter Agency Handle Followers in Thousands Census Bureau Uscensusbureau 118.4 Bureau of Labor Statistics BLS_gov 70.6 National Center for Education Statistics EdNCES 24.0 National Agricultural Statistics Service usda_nass 46.2 National Center for Health Statistics NCHStats 6.8 Energy Information Administration EIAgov 158.3 Bureau of Economic Analysis BEA_News 21.7 Economic Research Service USDA_ERS 42.5 Bureau of Justice Statistics BJSgov 3.7 Bureau of Transportation Statistics TransportStats 15.1 National Center for Science and Engineering Statistics NCSESgov (unverified) 0.08 IRS Statistics of Income Division Not on twitter - SSA Office of Research, Evaluation, and Statistics - Not on twitter Follower count data collected 8/12/2021
Anatomy of tweets and accounts Key Ideas Impressions Engagement Initial reach total views interactions followers Linking URL # Followers Verified Hashtag @Username External URL Comments Retweets Likes
Retweets as a proxy for impact Impressions are not directly observable Likes represent emotional engagement by users Likes don t increase reach on Twitter Comments represent emotional and informational engagement Comments don t increase reach on Twitter Retweets spread information and increase reach Retweets add your content to the timelines of other users
Everyday communication Only primary tweets are considered for statistics Retweeted posts, quoted posts, or replies are excluded Retweets follow power-law distribution (extreme outliers) Latest 3,000 Tweets from @uscensusbureau Focus on regular communication vs. virality Normalize retweet counts to rank value When comparing accounts When comparing tweets within accounts Number of observed samples Number of retweets
Novel dataset: Government accounts providing topical and continuous information All Twitter accounts 170M Verified Twitter accounts 382K Government Twitter accounts Collected metadata for verified accounts and filtered for those with .gov URLs 6K Info gov + People gov accounts Removed weather, traffic, law enforcement, parks, space, security accounts People gov accounts acted as control 1K+2K Collected latest 3,000 Tweets for each account = ~1.3M Tweets
Including and excluding accounts @justinbieber Verified, not gov @EIA Verified, info gov @NASA Verified, not info gov nor people gov @EleanorNorton Verified, people gov
Correlates of engagement Top tweets What characteristics correlate with the top tweets? Biased towards popular accounts Change in retweet rank (relative to population) given presence of element Example Statistic Top tweets (per account) Correlations with the top tweets normalized to the baseline of the account Represents actions account holders can take +7.8 Media Top accounts Relationship between account actions and follower counts? Optimal number of actions account holders can take Element
Actionable tweet features # hashtag @ mention external link media element
Top Tweets Change in percentile rank when including element Change in percentile rank when including element info gov +15.8 +8.4 -4.1 +3.9 Media @ mentions #hashtags External links people gov +4.5 -0.9 -7.1 +1.2 Media @ mentions #hashtags External links
Top Tweets (normalized per account) Change in percentile rank when including element Change in percentile rank when including element info gov +11.4 +4.7 -3.6 +2.2 Media @ mentions #hashtags External links people gov +5.0 +1.7 -4.7 +0.2 Media @ mentions #hashtags External links
Characteristics of influential accounts: Fraction of media posts vs retweet rank Positive linear relationship with usage of media for info gov; diminishing returns for people gov (30% optimal) info gov people gov Account rank by mean retweets Account rank by mean retweets Percentage of tweets from account with media Percentage of tweets from account with media
Characteristics of influential accounts: Fraction of external links vs retweet rank Relationship unclear for info gov; strong diminishing returns for people gov starting at 40% info gov people gov Account rank by mean retweets Account rank by mean retweets Percentage of tweets from account with external URL Percentage of tweets from account with external URL
Characteristics of influential accounts: Posting frequency vs retweet rank Posting frequently correlates with higher levels of engagement (stronger effect size for people gov) info gov people gov Account rank by mean retweets Account rank by mean retweets Mean time between posts Mean time between posts
Characteristics of influential accounts: Burst posting vs retweet rank Posting multiple times per day correlates with higher levels of engagement (stronger effect size for people gov) info gov people gov Account rank by mean retweets Account rank by mean retweets Mean number of posts/day given one post Mean number of posts/day given one post
Summary Twitter works differently for individual accounts and organizational accounts even within the federal government When it comes to reach and engagement: Media matters Positive correlation for info gov Twitter for all levels of media and reach People gov has a sweet spot at 30% usage Frequency counts Strong correlation to posting frequency, both in aggregate and bursts #Hashtags help (a little) Small but positive effect for info gov twitter
Thank you! Travis Hoppe Questions or comments? THoppe@cdc.gov Federal Committee on Statistical Methodology (FCSM) Research and Policy conference November 3rd, 2021
For more information, contact CDC 1-800-CDC-INFO (232-4636) TTY: 1-888-232-6348 www.cdc.gov The findings and conclusions in this report are those of the authors and do not necessarily represent the official position of the Centers for Disease Control and Prevention.


