Opioid Overdose Deaths in the U.S.: Trends and Analysis
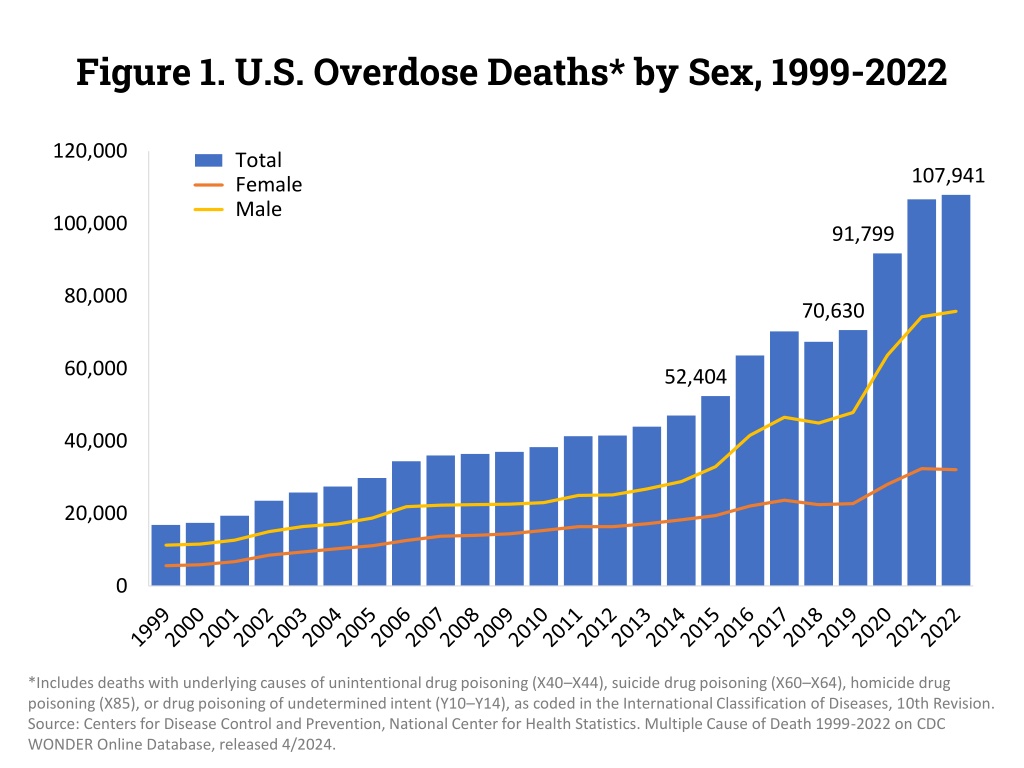
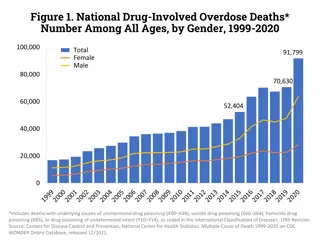
The figures illustrate the concerning rise in opioid overdose deaths in the United States from 1999 to 2022. Graphs depict overdose deaths by sex, specific drugs or drug categories, involvement of opioids, and prescription opioids. The data highlights the impact of opioids on both genders and the role of various types of opioids in contributing to overdose fatalities, emphasizing the urgency for effective prevention and intervention strategies.

Download Presentation

Please find below an Image/Link to download the presentation.
The content on the website is provided AS IS for your information and personal use only. It may not be sold, licensed, or shared on other websites without obtaining consent from the author. Download presentation by click this link. If you encounter any issues during the download, it is possible that the publisher has removed the file from their server.
E N D
Presentation Transcript
Figure 1. U.S. Overdose Deaths* by Sex, 1999-2022 120,000 Total Female Male 107,941 100,000 91,799 80,000 70,630 60,000 52,404 40,000 20,000 0 *Includes deaths with underlying causes of unintentional drug poisoning (X40 X44), suicide drug poisoning (X60 X64), homicide drug poisoning (X85), or drug poisoning of undetermined intent (Y10 Y14), as coded in the International Classification of Diseases, 10th Revision. Source: Centers for Disease Control and Prevention, National Center for Health Statistics. Multiple Cause of Death 1999-2022 on CDC WONDER Online Database, released 4/2024.
Figure 2. U.S. Overdose Deaths*, Select Drugs or Drug Categories, 1999-2022 100,000 Synthetic Opioids other than Methadone (primarily fentanyl) Psychostimulants with Abuse Potential (primarily methamphetamine) Cocaine 80,000 Prescription Opioids (natural & semi-synthetic opioids & methadone) Benzodiazepines Heroin 60,000 Antidepressants 40,000 20,000 0 1999 2012 2000 2001 2002 2003 2004 2005 2006 2007 2008 2009 2010 2011 2013 2014 2015 2016 2017 2018 2019 2020 2021 2022 *Includes deaths with underlying causes of unintentional drug poisoning (X40 X44), suicide drug poisoning (X60 X64), homicide drug poisoning (X85), or drug poisoning of undetermined intent (Y10 Y14), as coded in the International Classification of Diseases, 10th Revision. Source: Centers for Disease Control and Prevention, National Center for Health Statistics. Multiple Cause of Death 1999-2022 on CDC WONDER Online Database, released 4/2024.
Figure 3. U.S. Overdose Deaths Involving Any Opioid* by Sex, 1999-2022 100,000 Total Female Male 81,806 80,000 68,630 60,000 47,600 40,000 21,089 20,000 0 2017 1999 2000 2001 2002 2003 2004 2005 2006 2007 2008 2009 2010 2011 2012 2013 2014 2015 2016 2018 2019 2020 2021 2022 *Among deaths with drug overdose as the underlying cause, the any opioid subcategory was determined by the following ICD-10 multiple cause-of-death codes: natural and semi-synthetic opioids (T40.2), methadone (T40.3), other synthetic opioids (other than methadone) (T40.4), or heroin (T40.1). Source: Centers for Disease Control and Prevention, National Center for Health Statistics. Multiple Cause of Death 1999-2022 on CDC WONDER Online Database, released 4/2024.
Figure 4. U.S. Overdose Deaths Involving Prescription Opioids*, 1999-2022 25,000 Total Prescription Opioids in Combination with Synthetic Opioids Prescription Opioids without any other Opioid 20,000 17,029 16,706 14,716 14,139 15,000 10,000 5,000 0 1999 2000 2001 2002 2003 2004 2005 2007 2008 2009 2010 2011 2012 2013 2014 2015 2016 2017 2018 2019 2020 2021 2022 2006 *Among deaths with drug overdose as the underlying cause, the prescription opioid subcategory was determined by the following ICD-10 multiple cause-of-death codes: natural and semi-synthetic opioids (T40.2) or methadone (T40.3). Source: Centers for Disease Control and Prevention, National Center for Health Statistics. Multiple Cause of Death 1999-2022 on CDC WONDER Online Database, released 4/2024.
Figure 5. U.S. Overdose Deaths Involving Heroin*, by other Opioid Involvement, 1999-2022 25,000 All Heroin Heroin in Combination with Synthetic Opioids other than Methadone Heroin without any Other Opioid 20,000 15,469 15,000 13,165 9,173 10,000 5,871 5,000 0 2002 2011 2020 1999 2000 2001 2003 2004 2005 2006 2007 2008 2009 2010 2012 2013 2014 2015 2016 2017 2018 2019 2021 2022 *Among deaths with drug overdose as the underlying cause, the heroin category was determined by the T40.1 ICD-10 multiple cause-of-death code. Source: Centers for Disease Control and Prevention, National Center for Health Statistics. Multiple Cause of Death 1999-2022 on CDC WONDER Online Database, released 4/2024.
Figure 6. U.S. Overdose Deaths Involving Stimulants* (cocaine and psychostimulants with abuse potential), by Opioid Involvement, 1999-2022 60,000 57,497 Stimulants Stimulants in Combination with Synthetic Opioids other than Methadone Stimulants without any Opioid 50,000 40,643 40,000 30,000 20,000 12,122 10,000 0 2002 2017 1999 2000 2001 2003 2004 2005 2006 2007 2008 2009 2010 2011 2012 2013 2014 2015 2016 2018 2019 2020 2021 2022 *Among deaths with drug overdose as the underlying cause, the psychostimulants with abuse potential (primarily methamphetamine) category was determined by the T43.6 ICD-10 multiple cause-of-death code. Abbreviated to psychostimulants in the bar chart above. Source: Centers for Disease Control and Prevention, National Center for Health Statistics. Multiple Cause of Death 1999-2022 on CDC WONDER Online Database, released 4/2024.
Figure 7. U.S. Overdose Deaths Involving Psychostimulants with Abuse Potential (Primarily Methamphetamine)*, by Opioid Involvement, 1999-2022 60,000 All Psychostimulants Psychostimulants in Combination with Synthetic Opioids other than Methadone Psychostimulants without any Opioid 50,000 40,000 34,022 30,000 23,837 20,000 10,000 5,716 0 2002 2017 1999 2000 2001 2003 2004 2005 2006 2007 2008 2009 2010 2011 2012 2013 2014 2015 2016 2018 2019 2020 2021 2022 *Among deaths with drug overdose as the underlying cause, the psychostimulants with abuse potential (primarily methamphetamine) category was determined by the T43.6 ICD-10 multiple cause-of-death code. Abbreviated to psychostimulants in the bar chart above. Source: Centers for Disease Control and Prevention, National Center for Health Statistics. Multiple Cause of Death 1999-2022 on CDC WONDER Online Database, released 4/2024.
Figure 8. U.S. Drug Overdose Deaths Involving Cocaine*, by Opioid Involvement, 1999-2022 60,000 All Cocaine Cocaine in Combination with Synthetic Opioids other than Methadone Cocaine without any Opioid 50,000 40,000 27,569 30,000 20,000 15,883 10,000 6,784 0 2003 2013 1999 2000 2001 2002 2004 2005 2006 2007 2008 2009 2010 2011 2012 2014 2015 2016 2017 2018 2019 2020 2021 2022 *Among deaths with drug overdose as the underlying cause, the cocaine category was determined by the T40.5 ICD-10 multiple cause-of-death code. Source: Centers for Disease Control and Prevention, National Center for Health Statistics. Multiple Cause of Death 1999-2022 on CDC WONDER Online Database, released 4/2024.
Figure 9. U.S. Drug Overdose Deaths Involving Benzodiazepines*, by Opioid Involvement, 1999-2022 25,000 All Benzodiazepines Benzodiazepines in Combination with Synthetic Opioids other than Methadone Benzodiazepines without any Opioid 20,000 15,000 12,499 11,537 10,964 9,711 10,000 5,000 1,135 0 2005 2014 1999 2000 2001 2002 2003 2004 2006 2007 2008 2009 2010 2011 2012 2013 2015 2016 2017 2018 2019 2020 2021 2022 *Among deaths with drug overdose as the underlying cause, the benzodiazepine category was determined by the T42.4 ICD-10 multiple cause-of-death code. Source: Centers for Disease Control and Prevention, National Center for Health Statistics. Multiple Cause of Death 1999-2022 on CDC WONDER Online Database, released 4/2024.
Figure 10. U.S. Drug Overdose Deaths Involving Antidepressants*, by Opioid Involvement, 1999-2022 25,000 All Antidepressants Antidepressants in Combination with Synthetic Opioids other than Methadone Antidepressants without any Opioid 20,000 15,000 10,000 5,863 4,894 5,000 1,749 0 2011 2019 1999 2000 2001 2002 2003 2004 2005 2006 2007 2008 2009 2010 2012 2013 2014 2015 2016 2017 2018 2020 2021 2022 *Among deaths with drug overdose as the underlying cause, the antidepressant subcategory was determined by the following ICD-10 multiple cause-of-death codes: Tricyclic and tetracyclic antidepressants (T43.0), monoamine-oxidase-inhibitor antidepressants (T43.1), and other unspecified antidepressants (T43.2). Source: Centers for Disease Control and Prevention, National Center for Health Statistics. Multiple Cause of Death 1999-2022 on CDC WONDER Online Database, released 4/2024.