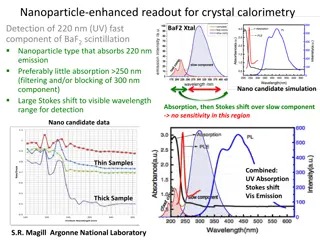
Investigation of PMT Rate Dependence in Calorimetry Study

Anastasia Basharina-Freshville from University College London conducted a study on the rate dependence of PMT response in a calorimetry experiment. The investigation involved pulsing an LED into a scintillator optically coupled to a PMT at various voltages and peak currents to analyze the behavior of the system. The study aimed to determine the rate at which the PMT response reaches 100 A, considering factors such as DC current, average anode current, and pulse characteristics. The setup included Hamamatsu PMTs with an active divider base, standard scintillators, and optical gel. Detailed measurements and data analysis were performed to understand the relationship between PMT performance and the rate of incoming protons.
- PMT Rate Dependence
- Calorimetry Study
- University College London
- Anastasia Basharina-Freshville
- Photon Counting

Download Presentation

Please find below an Image/Link to download the presentation.
The content on the website is provided AS IS for your information and personal use only. It may not be sold, licensed, or shared on other websites without obtaining consent from the author. Download presentation by click this link. If you encounter any issues during the download, it is possible that the publisher has removed the file from their server.
E N D
Presentation Transcript
PMT Rate Dependence Investigation Anastasia Basharina-Freshville (University College London) 23/09/2024 PT Calorimetry 1
Introduction Various test beams have shown that there is some sort of dependence of the PMT response on the rate of the proton beam. In particular of note is data from: Clatterbridge August 2016 (http://www.hep.ucl.ac.uk/pbt/wikiData/presentations/2016/clatterbridge_aug2016_analysis.pptx) Clatterbridge November 2016 (http://www.hep.ucl.ac.uk/pbt/wikiData/presentations/2016/clatterbridge_nov2016_analysis.pptx) medAustron March 2017 (http://www.hep.ucl.ac.uk/pbt/wikiData/presentations/2017/medAustron_mar2017_analysis.pptx) Investigate this at UCL by: pulsing an LED via an optical fibre into the scintillator optically coupled to the PMT at a voltage that matches a specific peak current study response at several PMT operational high voltages and several peak currents 23/09/2024 PT Calorimetry 2
PMT Currents When considering a PMT, there are two main currents to consider: The DC current running through the resistor chain, Idivider(also know as the bleeder current) The average anode current, Iaav, which is the current caused by the avalanche of electrons and travels in the opposite direction to Idiv Iaav dynodes CATHODE -ve ANODE +ve resistors Idivider In order for the PMT to function correctly Iaav << Idiv! For the R13089-100-11 PMT with the negative Hamamatsu active divider base to function correctly: Iaav < 100 A, according to Hamamatsu specifications Pulse LED at several different peak currents and rates and observe behaviour when Iaav 100 A is reached, using the following to estimate what rate this happens at: Iaav Iapeak= peak current at the anode, A = pulse height (V)/impedence ( ), t = pulse width at the full width at half maximum, s, f = frequency, Hz. = average anode current, A, a(node)= Ipeak a(node).Dt(fwhm).f Iav(erage) where 23/09/2024 PT Calorimetry 3
Measurement Setup 1: 2 Hamamatsu R13089-100-11 PMT with negative HV active divider base (made by Hamamatsu) 3 cm x 3 cm x 5 cm cuboid ENVINET standard scintillator Coupled with BC-630 Saint Gobain silicone optical gel (refractive index = 1.465) http://www.crystals.saint-gobain.com/uploadedFiles/SG- Crystals/Documents/Organic%20Product%20Accessories%20Data%20Sheet.pdf 23/09/2024 PT Calorimetry 4
HV: -900 V, Ipeak = 10 mA (1) Hamamatsu Base PMT Pulsed with LED: 10 mA Peak Current, ET Hamamatsu Base PMT Pulsed with LED: 10 mA Peak Current, ET 6200 6200 ADC Mean, ADC Counts ADC Mean, ADC Counts LED pulsed at: 2.22 V Pulse amplitude: 498.8 mV Pulse width (fwhm): 10.52 ns Rate for 100 A: 950 kHz 6000 6000 5800 5800 5600 5600 zoom region: 0 10 kHz 5400 5400 5200 5200 5000 5000 4800 4800 0 200 400 600 800 1000 0 2 4 6 8 10 Rate, kHz Rate, kHz Deviation from linearity occurs at: - unknown for this measurement, carried out before the Iaav deductions were made But we also see another effect: - A ~ 10% drop in ADC mean at lower rates of 500 Hz 3 kHz - This effect goes with the current, as seen on slide 7. - What could be causing this? 23/09/2024 PT Calorimetry 5
HV: -900 V, Ipeak = 10 mA (2) Hamamatsu Base PMT at -900 V Pulsed with LED: 10 mA Peak Current, ET Hamamatsu Base PMT at -900 V Pulsed with LED: 10 mA Peak Current, ET ADC Mean, ADC Counts ADC Mean, ADC Counts 17.03.2017 17.03.2017 6000 6000 27.03.2017 27.03.2017 5000 5000 4000 4000 zoom region: 0 100 kHz LED pulsed at: 2.09 V Pulse amplitude: 487.8 mV Pulse width (fwhm): 9.76 ns Rate for 100 A: 1.05 MHz 3000 3000 2000 2000 1000 1000 0 2000 4000 6000 8000 10000 0 20 40 60 80 100 Rate, kHz Rate, kHz Repeat tests at a slightly later date in order to reach rates required for Iaav 100 ?A Deviation from linearity occurs at at ~ 1.2 MHz, corresponding to an anode average current, IA 113 ?A But for this set of measurements we no longer see the decrease in amplitude effect between 0 and 5 kHz! - Why?! 23/09/2024 PT Calorimetry 6
HV: -900 V, Ipeak = 1 mA (1) Hamamatsu Base PMT Pulsed with LED: 1 mA Peak Current, ET Hamamatsu Base PMT Pulsed with LED: 1 mA Peak Current, ET 610 610 ADC Mean, ADC Counts ADC Mean, ADC Counts LED pulsed at: 1.96 V Pulse amplitude: 48.12 mV Pulse width (fwhm): 9.06 ns Rate for 100 A: 11.0 MHz 600 600 590 590 580 580 570 570 zoom region: 0 40 kHz 560 560 550 550 540 540 530 530 0 200 400 600 800 1000 0 5 10 15 20 25 30 35 40 Rate, kHz Rate, kHz Deviation from linearity occurs at: - unknown for this measurement, carried out before the Iaav deductions were made But we see the ADC drop effect again: - A ~ 10% drop in ADC mean at rates of 10 kHz 30 kHz - This effect goes with the current (compare to 500 Hz 3 kHz for a peak current of 10 mA, slide 5). - What could be causing this? 23/09/2024 PT Calorimetry 7
HV: -900 V, Ipeak = 1 mA (2) Hamamatsu Base PMT Pulsed with LED: 1 mA Peak Current, -900 V 600 ADC Mean, ADC Counts 580 560 540 LED pulsed at: 1.90 V Pulse amplitude: 51.77 mV Pulse width (fwhm): 8.48 ns Rate for 100 A: 11.3 MHz 520 500 480 460 440 420 400 0 2000 4000 6000 8000 10000 Rate, kHz Deviation from linearity occurs at: - Unable to pulse LED at a rate high enough But for this set of measurements we no longer see the decrease in amplitude effect between 10 and 30 kHz! - Why?! 23/09/2024 PT Calorimetry 8
HV: -1200 V, Ipeak = 12 mA Hamamatsu Base PMT at -1200 V Pulsed with LED: 12 mA Peak Current, ET Hamamatsu Base PMT at -1200 V Pulsed with LED: 12 mA Peak Current, ET ADC Mean, ADC Counts ADC Mean, ADC Counts 7000 7000 6000 6500 5000 6000 4000 zoom region: 0 1600 kHz 5500 3000 LED pulsed at: 1.96 V Pulse amplitude: 606.2 mV Pulse width (fwhm): 8.56 ns Rate for 100 A: 970 kHz 2000 5000 1000 4500 0 4000 0 1000 2000 3000 4000 5000 6000 7000 8000 9000 0 200 400 600 800 1000 1200 1400 1600 Rate, kHz Rate, kHz Deviation from linearity occurs at at ~ 1.4 MHz, corresponding to an anode average current, Iaav 145 ?A Again, for this set of measurements we do not see the decrease in amplitude effect! - Why?! 23/09/2024 PT Calorimetry 9
HV: -1200 V, Ipeak = 2 mA Hamamatsu Base PMT at -1200 V Pulsed with LED: 2 mA Peak Current, ET ADC Mean, ADC Counts 1150 1100 LED pulsed at: 1.86 V Pulse amplitude: 106.6 mV Pulse width (fwhm): 8.00 ns Rate for 100 A: 6.25 MHz 1050 1000 950 0 2000 4000 6000 8000 10000 Rate, kHz Deviation from linearity occurs at ~ 9 MHz, corresponding to an anode average current, Iaav 145 ?A Again, for this set of measurements we do not see the decrease in amplitude effect! - Why?! Conclusionsfor short scintillator measurements: - For Iaav > 100 ?A we see behaviour in line with expectation - For some measurements (2/7) we see an effect where the ADC mean decreases by ~ 10% at low rates. Currently the cause of this is not understood. 23/09/2024 PT Calorimetry 10
Measurement Setup 2: 2 Hamamatsu R13089-100-11 PMT with negative HV active divider base (made by Hamamatsu) 3 cm x 3 cm x 45 cm cuboid ENVINET standard scintillator Coupled with BC-630 Saint Gobain silicone optical gel (refractive index = 1.465) http://www.crystals.saint-gobain.com/uploadedFiles/SG- Crystals/Documents/Organic%20Product%20Accessories%20Data%20Sheet.pdf Aim: Do we see the same behaviour for Iaav > 100 ?A with our long scintillator as we do with the short? 23/09/2024 PT Calorimetry 11
HV: -1200 V, Ipeak = 12 mA Hamamatsu Base PMT at -1200 V Pulsed with LED: 12 mA Peak Current, ET, Long Scintillator Hamamatsu Base PMT at -1200 V Pulsed with LED: 12 mA Peak Current, ET, Long Scintillator ADC Mean, ADC Counts ADC Mean, ADC Counts 8000 8000 7000 7000 6000 6000 5000 5000 zoom region: 0 100 kHz 4000 4000 LED pulsed at: 2.13 V Pulse amplitude: 614.3 mV Pulse width (fwhm): 11.15 ns Rate for 100 A: 730 kHz 3000 3000 2000 2000 1000 1000 0 2000 4000 6000 8000 10000 0 20 40 60 80 100 Rate, kHz Rate, kHz Deviation from linearity occurs at ~ 1.3 MHz, corresponding to an anode average current, Iaav 180 ?A But we also see another effect: - A ~ 20% drop in ADC mean at lower rates of 10 30 kHz - This effect goes with the current, as seen on slide 13. - What could be causing this? 23/09/2024 PT Calorimetry 12
HV: -1200 V, Ipeak = 2 mA Hamamatsu Base PMT at -1200 V Pulsed with LED: 2 mA Peak Current, ET, Long Scintillator Hamamatsu Base PMT at -1200 V Pulsed with LED: 2 mA Peak Current, ET, Long Scintillator ADC Mean, ADC Counts ADC Mean, ADC Counts 1150 1150 LED pulsed at: 1.95 V Pulse amplitude: 96.6 mV Pulse width (fwhm): 10.07 ns Rate for 100 A: 5.15 MHz 1100 1100 1050 1050 zoom region: 0 1000 kHz 1000 1000 950 950 900 900 850 850 0 2000 4000 6000 8000 10000 0 200 400 600 800 1000 Rate, kHz Rate, kHz Deviation from linearity occurs at ~ 9.3 MHz, corresponding to an anode average current, Iaav 180 ?A But we also see another effect: - A ~ 20% drop in ADC mean at lower rates of 50 180 kHz - This effect goes with the current, compare to 10 30 kHz for a peak current of 12 mA, slide 12). - What could be causing this? 23/09/2024 PT Calorimetry 13
HV: -900 V, Ipeak = 10 mA Hamamatsu Base PMT at -900 V Pulsed with LED: 10 mA Peak Current, ET, Long Scintillator Hamamatsu Base PMT at -900 V Pulsed with LED: 10 mA Peak Current, ET, Long Scintillator ADC Mean, ADC Counts ADC Mean, ADC Counts 7000 7000 6000 6000 5000 5000 4000 4000 zoom region: 0 100 kHz LED pulsed at: 2.46 V Pulse amplitude: 493.3 mV Pulse width (fwhm): 12.81 ns Rate for 100 A: 791 kHz 3000 3000 2000 2000 1000 1000 0 2000 4000 6000 8000 10000 0 20 40 60 80 100 Rate, kHz Rate, kHz Deviation from linearity occurs at ~ 1.2 MHz, corresponding to an anode average current, Iaav 150 ?A But we also see another effect: - A ~ 20% drop in ADC mean at lower rates of 5 10 kHz - This effect goes with the current, as seen on slide 15. - What could be causing this? 23/09/2024 PT Calorimetry 14
HV: -900 V, Ipeak = 1 mA Hamamatsu Base PMT at -900 V Pulsed with LED: 1 mA Peak Current, ET, Long Scintillator Hamamatsu Base PMT at -900 V Pulsed with LED: 1 mA Peak Current, ET, Long Scintillator ADC Mean, ADC Counts ADC Mean, ADC Counts 580 580 LED pulsed at: 2.01 V Pulse amplitude: 51.03 mV Pulse width (fwhm): 10.7 ns Rate for 100 A: 9.16 MHz 560 560 540 540 520 520 zoom region: 0 1000 kHz 500 500 480 480 460 460 440 440 420 420 0 2000 4000 6000 8000 10000 0 200 400 600 800 1000 Rate, kHz Rate, kHz Deviation from linearity occurs at ~ 14 MHz, corresponding to an anode average current, Iaav 150 ?A - Deduced from increase in the current drawn by the PMT, monitored on the HV unit But we also see another effect: - A ~ 20% drop in ADC mean at lower rates of 50 100 kHz - This effect goes with the current, compare to 5 10 kHz for a peak current of 10 mA, slide 14). - What could be causing this? Effect seen for 4/4 measurements with the long scintillator! 23/09/2024 PT Calorimetry 15
Conclusions for Rate Tests For Iaav > 100 ?A we see behaviour in line with expectation both when using a short (3 cm x 3 cm x 5 cm) and long (3 cm x 3 cm x 45 cm) scintillators For some measurements (6/11) we see an effect where the ADC mean decreases by ~ 10% at low rates. Currently the cause of this is not understood. - We are shortly contacting Hamamatsu with these results to see if they can shed any light on this Meanwhile, we have ordered new PMT bases from Hamamatsu to help us keep the PMT in its working regime for Iaav > 100 ?A: - Base with signal collected from the 4th dynode - Base with signal collected from the 5th dynode - Gated base - Base with tapered divider 23/09/2024 PT Calorimetry 16
Measurement Setup 3: 2 Hamamatsu R13089-100-11 PMT with negative HV active divider base (made by Hamamatsu) 3 cm x 3 cm x 3 cm cuboid ENVINET standard scintillator Coupled with BC-630 Saint Gobain silicone optical gel (refractive index = 1.465) http://www.crystals.saint-gobain.com/uploadedFiles/SG- Crystals/Documents/Organic%20Product%20Accessories%20Data%20Sheet.pdf Usual short cables used for testing at UCL replaced with the cable setup used during test beams Aim: Do the long BNC and HV cables we use during test beam affect our measurements in any way? 23/09/2024 PT Calorimetry 17
HV: -1200 V, Ipeak 12 mA: -1200 V, 11.3 mA Peak Current: 1.5 MHz with Test Beam Cables 2 x 15 m BNC cables, 2 x 25 m SHV cables adc adc adc adc adc adc adc adc adc adc -1200 V, 11.3 mA Peak Current: 2 MHz Comparison -1200 V, 11.3 mA Peak Current: 2 MHz Comparison Entries Mean RMS RMS Entries Mean 20001 5694 300.2 300.2 20001 5694 Entries Entries Entries Entries Entries Entries Entries Mean Mean Mean Mean Mean Mean Mean Entries Mean RMS RMS RMS RMS RMS RMS RMS RMS 20001 4270 4336 4780 4341 4772 4764 4340 20001 4203 516.8 255.7 629.4 417.8 625.8 576.5 574.4 625 20001 20001 20001 20001 20001 20001 22000 90 ns gate, LEMO bundle, 2 x 15 m BNC 16000 250 ns gate, 1 LEMO, 2 x 15 m BNC 20000 LED pulsed at: 1.96 V Pulse amplitude: 566.5 mV Pulse width (fwhm): 8.53 ns Rate for 100 A: 1.03 MHz 250 ns gate, 1 LEMO, 1 x short BNC 14000 250 ns gate, 1 LEMO, 2 x 15 m BNC 250 ns gate, 1 LEMO, 1 x 15 m BNC(1) 18000 12000 16000 250 ns gate, 1 LEMO, 1 x 15 m BNC(2) Number of events Number of events 250 ns gate, 1 LEMO, 2 x 15 m BNC 14000 10000 12000 Tested with: 1 x short BNC 1 x 15 m BNC (1) 1 x 15 m BNC (2) 2 x 15 m BNC 8000 10000 6000 8000 6000 4000 4000 2000 2000 0 0 3500 4000 4500 5000 5500 6000 2500 3000 3500 4000 4500 5000 5500 ADC Counts ADC Counts During data taking it was noticed that data started looking non-Gaussian around the peak, rather than just the usual non-Gaussian tail seen on the left of the spectrum that appears at ~ 2 MHz For a gate of 250 ns at a rate of 2 MHz using the long BNC cables starts introducing multiple peaks this data is not useable to extract the E/E. - Has this affected us during test beam? - Look at a gate of 90 ns (usual acquisition gate for these tests and closer to test beam) 23/09/2024 PT Calorimetry 18
HV: -1200 V, Ipeak 12 mA: -1200 V, 11.3 mA Peak Current: 500 kHz Comparison -1200 V, 11.3 mA Peak Current: 500 kHz Comparison 2 x 15 m BNC cables, 2 x 25 m SHV cables adc adc adc adc adc adc adc adc adc adc -1200 V, 11.3 mA Peak Current: 500 kHz Comparison Entries Entries Entries Entries Mean Mean Mean Mean Entries Mean RMS RMS RMS RMS RMS 20001 5045 5165 5132 5382 20001 5027 292 151.5 269.9 267.2 246.9 20001 20001 20001 Entries Entries Entries Entries Mean Mean Mean Mean Entries Mean RMS RMS RMS RMS RMS 20001 5045 151.5 151.5 269.9 267.2 246.9 20001 5045 5165 5132 5382 20001 20001 20001 90 ns gate, 2 x 15 m BNC 90 ns gate, 2 x 15 m BNC 16000 4 10 90 ns gate, 1 x 15 m BNC(1) 90 ns gate, 1 x 15 m BNC(1) 14000 90 ns gate, 1 x 15 m BNC(2) 90 ns gate, 1 x 15 m BNC(2) 3 12000 10 90 ns gate, 1 x short BNC 90 ns gate, 1 x short BNC Number of events Number of events 10000 Tested with: 1 x short BNC 1 x 15 m BNC (1) 1 x 15 m BNC (2) 2 x 15 m BNC 2 10 8000 6000 10 4000 LED pulsed at: 1.96 V Acquisition gate: 90 ns 2000 1 0 3500 4000 4500 5000 5500 6000 3500 4000 4500 5000 5500 6000 ADC Counts ADC Counts The peak first starts to look non-Gaussian for setups involving one or two long BNC cables at ~ 500 kHz - Rates we work with at test beam! Other observations: - Able to extract a rough ADC mean up to a rate of ~ 2 MHz - cannot be extracted accurately for rates > 1 MHz - And when we can obtain a measurement of it is larger for tests done with long cables compared to tests with the short cable 23/09/2024 PT Calorimetry 19
HV: -1200 V, Ipeak 12 mA: 2 x 15 m BNC cables, 2 x 25 m SHV cables Comparison of Cable Set Ups at -1200 V, 11.3 mA Peak Current, 90 ns Gate 5600 ADC Mean, ADC Coutns 5400 5200 5000 4800 2 x 15 m BNC cables 1 x 15 m BNC cable (1) 1 x 15 m BNC cable (2) 1 Short Original BNC cable 4600 4400 4200 0 200 400 600 800 1000 1200 1400 1600 1800 2000 Rate, kHz ADC mean as a function of rates for all BNC cable setups: - We still see the same trend, but a change in mean. 23/09/2024 PT Calorimetry 20
HV: -1200 V, Ipeak 12 mA: 1 x short BNC cable, 2 x 25 m SHV cables adc Entries 20001 Mean 2092 RMS 388.3 RMS 56.05 RMS 390.6 RMS 381.5 RMS 389.2 90 ns gate, 2 x 25 m HV adc adc adc adc -1200 V, 11.3 mA Peak Current: 5 MHz HV Comparison -1200 V, 11.3 mA Peak Current: 5 MHz HV Comparison Comparison of HV Cable Set Ups at -1200 V, 11.3 mA Peak Current, 90 ns Gate Entries Mean Mean Mean Mean Entries Entries Entries 20001 2214 2089 2084 2082 20001 20001 20001 5600 ADC Mean, ADC Coutns 50000 5500 90 ns gate, 1 x 25 m HV(1) 5400 90 ns gate, 1 x 25 m HV(2) 40000 5300 90 ns gate, 1 x short HV Number of events 5200 30000 Tested with: 1 x short HV 1 x 25 m HV (1) 1 x 25 m HV (2) 2 x 25 m HV 5100 5000 20000 2 x 25 m HV cables 1 x 25 m HV cable (1) 1 x 25 m HV cable (2) 1 Short HV cable 4900 4800 10000 4700 0 4600 1900 1950 2000 2050 2100 2150 2200 2250 2300 2350 0 200 400 600 800 1000 1200 1400 1600 1800 2000 Rate, kHz ADC Counts Using long HV cables does not affect the data, as can be seen above for an example at 5 MHz. Tests were carried out up to 10 MHz with no effect due to using long HV cables observed. Other observations: - Some change in the mean is seen in the ADC mean as a function of rate plot above, but this change is too small to impact the E/E. 23/09/2024 PT Calorimetry 21
Conclusions for Long Cable Tests Using long HV cables does not effect the ADC distribution Using long BNC cables DOES effect the distribution: - From a rate as low as 500 kHz - Could have impacted our previous test beam data! Solutions: - The CAEN digitiser cannot be put on any network, either wirelessly or wired. - CAEN currently have no products that are able to do this, but are working on it. - Instead, we have to set up a network with two (or more) computers: One Windows machine that will remain in the treatment room, that the digitiser will be connected to. A second laptop that will be in the control room and can access the Windows machine in the treatment room to control the digitiser. This has now been set up and tested using Microsoft Remote Desktop and a router. Next, work on adding the oscilloscope to the Windows machine so it can also be controlled remotely. Also can we get a good quality enough splitter to not affect our signal?! 23/09/2024 PT Calorimetry 22


")
")
")
")