Review of Solvency Framework in Healthcare Sector


The Solvency Framework Review
Emile Stipp
Discovery Health


Background of solvency framework review

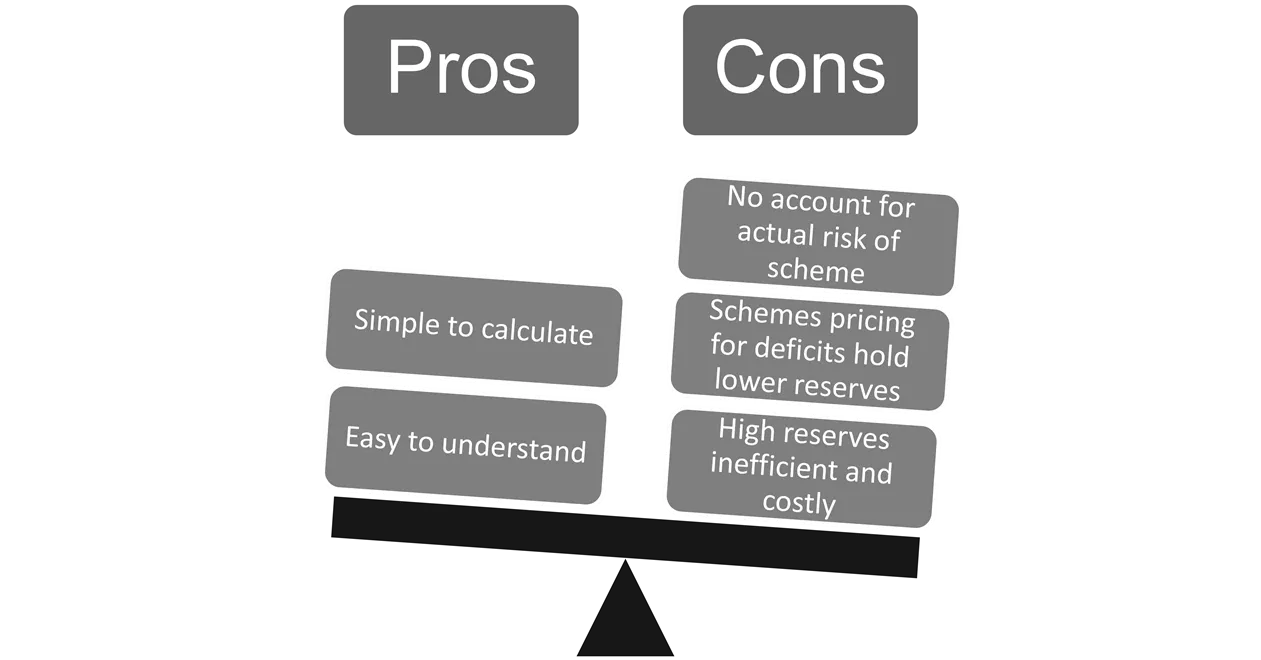
Current Solvency Framework
Objective of ITAP’s RBC framework
•
ITAP developed an internal model for use by
CMS to prospectively identify medical
schemes at high risk of failure
–
This will allow CMS to intervene timeously
–
Highlight schemes for further investigation
•
This should be expanded to a full RBC
framework
Main risks facing a scheme
Both the CMS and ITAP models account for major risks and express risk as a percentage
of contributions
However, the models differ in the following ways:
Features of the ITAP and CMS models
Liability risk – ITAP proposal
•
Liquidity risk
•
Schemes need to hold capital to fund claims and expenses in the
months where contributions are insufficient to cover this
•
Months with high seasonality
•
Claims volatility risk
•
Formula based on scheme size
•
Pricing risk
•
Use operating result of last 3 years
•
More weight for more recent years
Costly, time consuming and complex
Parameterization at an industry level difficult
Double counts the asset risk
No IBNR or catastrophic component
(also applies to ITAP model)
Liability risk – CMS proposal
CMS proposes a stochastic model with 3 year time horizon
?
?
?
?
•
Model projects future cashflows of a scheme on a monthly basis to calculate the
probability of ruin
•
Assumptions are required for all variables on income statement
Would expect a decreasing solvency requirement with increasing scheme size, however this relationship is
not observed when using the CMS model
Business risk of DH administered schemes as calculated using CMS stochastic model
Business risk capital required (% of risk contributions)
Assessment of CMS liability risk model
•
Bad debts
•
Use prior year net impairment losses, trade and other
receivables
•
Expense risk
•
Risk exists where scheme winds down
•
Claims can still be submitted 4 months after treatment
•
Propose holding 2.5 months of expenses
•
Default by third parties
•
Third parties not required to hold capital
•
If third party defaults, scheme is liable to settle claims
•
As the liability risk is calculated on the full contribution,
there is already an implicit allowance for this risk
•
Propose that no explicit allowance be made
Operational risk – ITAP proposal
It is inappropriate to hold reserves for operational risk
Tick box approach may not capture risk
Subjective
Complaints may be unfounded / in response to legitimate risk interventions
Unclear how a compliance score can be calibrated to a probability of ruin
Operational risk – CMS proposal
CMS proposes a compliance and complaints indicators
?
?
?
?
?
•
An index for both compliance and complaints will be calculated for each scheme
•
The index scores will be translated into the amount of capital required (as a % of premiums)
•
Elements of asset risk
•
Unexpected loss in capital value and/or
•
Unexpected decreases in income
•
Method of quantifying asset risk
•
Assume the lowest annual return by asset class in
the last 50 years
•
Asset Risk is the percentage of additional
capital required to withstand a worst case
decrease in all asset classes
simultaneously
Asset risk – ITAP proposal
•
Example values could be:
–
Cash default risk assumed 0.03%
–
Property lowest return of -10.1%
–
Bonds: -17.7%
–
Equities: -25.8%
•
These values are only illustrative
•
Asset classes may need to be divided further e.g. government vs.
corporate bonds
Asset risk – ITAP proposal
Asset risk – ITAP proposal
Assumes asset classes are 100% correlated
Risk capital requirements unresponsive to market cycles
(also applies to ITAP model)
Asset risk classes are too broad
(also applies to ITAP model)
Asset risk – CMS proposal
CMS proposes asset risk must protect against extreme
market events
?
?
?
•
Extreme markets events are defined as the maximum loss (over a certain time period) for
each asset class
•
The asset risk is calculated as the weighted sum of the maximum loss for each asset class,
where the weights are the distribution of assets by class
RBC formula – ITAP proposal
Results – ITAP proposal
•
After taking out the schemes that subsequently amalgamated:
•
5 of the 15 schemes were below 25% in 2015 and would have had to
build solvency anyway
•
The others have had consistently large operating deficits
•
Very few schemes are thus negatively impacted compared to their 2015
position
Results – ITAP proposal
•
E
x
a
m
p
l
e
1
:
A
s
s
e
t
s
p
l
i
t
a
s
f
o
l
l
o
w
s
:
–
Cash:
65%
–
Property:
5%
–
Bonds:
20%
–
Equities:
10%
–
Asset risk term = 6.6%
–
If Total risk (excluding asset risk) was 30%, this would increase to 30.7%
•
E
x
a
m
p
l
e
2
:
A
s
s
e
t
s
p
l
i
t
a
s
f
o
l
l
o
w
s
:
–
Cash:
30%
–
Property:
10%
–
Bonds:
30%
–
Equities:
30%
–
Asset risk term = 14.1%
–
If Total risk (excluding asset risk) was 30%, this would increase to 33.1%
•
The more risky the asset mix, the greater the required solvency
Impact of Asset Risk – ITAP proposal
•
The formula will penalise a scheme for pricing for operating deficits
•
RBC increases by more than the recent deficit
•
E
x
a
m
p
l
e
1
:
–
Scheme has had only operating surpluses
–
Operational risk of 3%
–
Financial risk of 16.6%
–
T
o
t
a
l
r
i
s
k
(
e
x
c
l
u
d
i
n
g
a
s
s
e
t
r
i
s
k
)
i
s
t
h
u
s
:
1
6
.
9
%
•
E
x
a
m
p
l
e
2
:
–
Same scheme but with an operating deficit of 5% of contributions in prior year
–
Financial risk increases to 24.1%
–
T
o
t
a
l
r
i
s
k
(
e
x
c
l
u
d
i
n
g
a
s
s
e
t
r
i
s
k
)
i
s
n
o
w
:
2
4
.
2
%
•
E
x
a
m
p
l
e
3
:
–
Same scheme as Example 1 but with an operating deficit of 5% of contributions
in prior 2 years
–
Financial risk increases to 29.1%
–
T
o
t
a
l
r
i
s
k
(
e
x
c
l
u
d
i
n
g
a
s
s
e
t
r
i
s
k
)
i
s
n
o
w
:
2
9
.
3
%
Pricing for an operating deficit
•
Cash:
65%
•
Property:
5%
•
Bonds:
20%
•
Equities:
10%
Example 1 – ITAP proposal
•
Cash:
30%
•
Property:
10%
•
Bonds:
30%
•
Equities:
30%
Example 2 – ITAP proposal
•
Some further work required to refine ITAP proposal
•
ITAP model relatively simple to establish to allow a move to an RBC approach
•
Very few schemes negatively impacted
–
In most cases solvency for impacted schemes are below the required levels currently
•
Accumulated funds at an industry level unlikely to reduce as RBC requirements
increase if a scheme prices for an operating loss
–
Member security will thus not decrease
•
Contribution increases can be lower as schemes can price for lower but more
appropriate solvency levels
•
Schemes are able to reduce their solvency requirements by managing their risks
better
Conclusion ITAP model
•
The industry welcomes the initiative by the CMS to review the current solvency
framework
•
The industry appreciates that the CMS recognizes the shortcomings of the current
solvency framework and the impact of these shortcomings on the sustainability of
medical schemes
•
The discussion document published by the CMS in November 2015 recognizes
that the process of determining adequate capital requirements is multi-faceted
with a myriad of factors that must be considered to efficiently protect schemes
against their individual risks
•
The industry appreciates the CMS’s collaborative stance, and stakeholders are
looking forward to working with the CMS to determine the best RBC framework
for the industry
Closing remarks on the CMS model
This review examines the Solvency Framework in Healthcare, discussing current framework, proposed changes, risks faced by schemes, and comparison of ITAP and CMS models in managing liabilities. It highlights the need for effective risk assessment and intervention strategies to ensure financial stability in the industry.

Download Presentation

Please find below an Image/Link to download the presentation.
The content on the website is provided AS IS for your information and personal use only. It may not be sold, licensed, or shared on other websites without obtaining consent from the author.If you encounter any issues during the download, it is possible that the publisher has removed the file from their server.
You are allowed to download the files provided on this website for personal or commercial use, subject to the condition that they are used lawfully. All files are the property of their respective owners.
The content on the website is provided AS IS for your information and personal use only. It may not be sold, licensed, or shared on other websites without obtaining consent from the author.
E N D
Presentation Transcript
The Solvency Framework Review The Solvency Framework Review Emile Stipp Emile Stipp Discovery Health Discovery Health 1
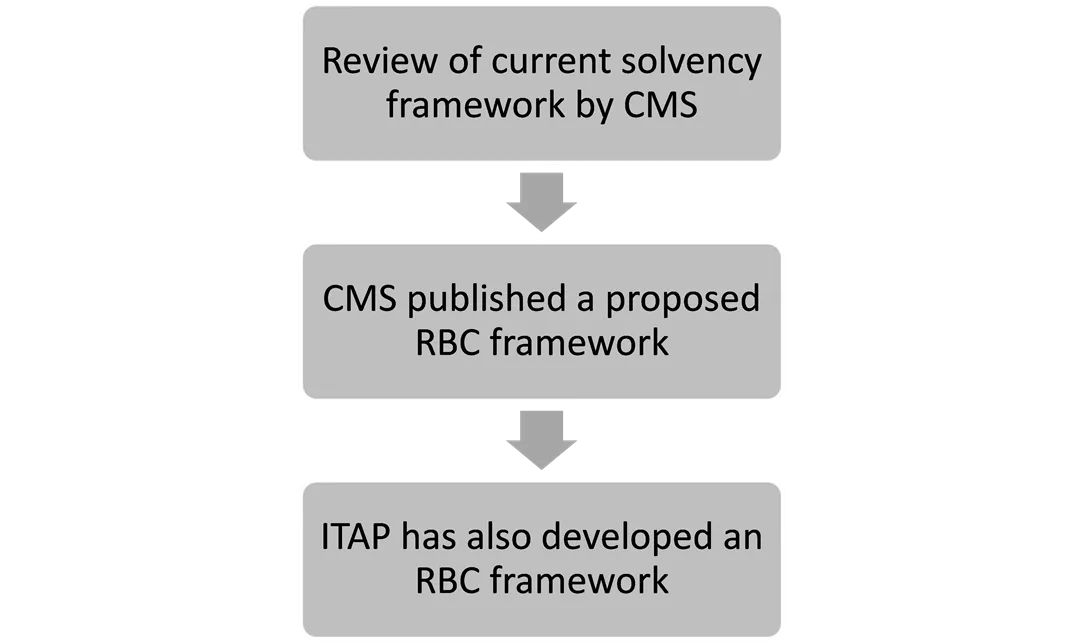
Background of solvency framework review Current Solvency Framework Pros Cons Review of current solvency framework by CMS CMS published a proposed RBC framework ITAP has also developed an RBC framework 2
Objective of ITAPs RBC framework ITAP developed an internal model for use by CMS to prospectively identify medical schemes at high risk of failure This will allow CMS to intervene timeously Highlight schemes for further investigation This should be expanded to a full RBC framework 3
Main risks facing a scheme Liability Operational Asset 4
Features of the ITAP and CMS models Both the CMS and ITAP models account for major risks and express risk as a percentage of contributions However, the models differ in the following ways: ITAP simpler, objective, based on available data CMS more complex, subjective areas, certain data unavailable Model Features ITAP 1 year CMS 3 year business risk, 1 year asset risk Time horizon 1 in 200 years 1 in 100 over 3 years Prob. of loss 5
Liability risk ITAP proposal Liquidity risk Schemes need to hold capital to fund claims and expenses in the months where contributions are insufficient to cover this Months with high seasonality Claims volatility risk Formula based on scheme size Pricing risk Use operating result of last 3 years More weight for more recent years 6
Liability risk CMS proposal CMS proposes a stochastic model with 3 year time horizon Model projects future cashflows of a scheme on a monthly basis to calculate the probability of ruin Assumptions are required for all variables on income statement ? ? Costly, time consuming and complex No IBNR or catastrophic component (also applies to ITAP model) ? ? Parameterization at an industry level difficult Double counts the asset risk 7
Assessment of CMS liability risk model Business risk of DH administered schemes as calculated using CMS stochastic model Business risk capital required (% of risk contributions) 60% 50% 40% 30% 20% 10% 0% 1,000 10,000 100,000 1,000,000 10,000,000 Scheme Size (Log Scale) Would expect a decreasing solvency requirement with increasing scheme size, however this relationship is not observed when using the CMS model 8
Operational risk ITAP proposal Bad debts Use prior year net impairment losses, trade and other receivables Expense risk Risk exists where scheme winds down Claims can still be submitted 4 months after treatment Propose holding 2.5 months of expenses Default by third parties Third parties not required to hold capital If third party defaults, scheme is liable to settle claims As the liability risk is calculated on the full contribution, there is already an implicit allowance for this risk Propose that no explicit allowance be made 9
Operational risk CMS proposal CMS proposes a compliance and complaints indicators An index for both compliance and complaints will be calculated for each scheme The index scores will be translated into the amount of capital required (as a % of premiums) ? It is inappropriate to hold reserves for operational risk ? ? ? ? Unclear how a compliance score can be calibrated to a probability of ruin Tick box approach may not capture risk Subjective Complaints may be unfounded / in response to legitimate risk interventions 10
Asset risk ITAP proposal Elements of asset risk Unexpected loss in capital value and/or Unexpected decreases in income Method of quantifying asset risk Assume the lowest annual return by asset class in the last 50 years Asset Risk is the percentage of additional capital required to withstand a worst case decrease in all asset classes simultaneously 11
Asset risk ITAP proposal Example values could be: Cash default risk assumed 0.03% Property lowest return of -10.1% Bonds: -17.7% Equities: -25.8% These values are only illustrative Asset classes may need to be divided further e.g. government vs. corporate bonds 12
Asset risk ITAP proposal Free Assets Asset risk capital should only apply to assets held to cover liabilities Total assets Assets above liabilities are deemed free assets Assets to cover liabilities Free assets could be invested less conservatively to allow for greater returns 13
Asset risk CMS proposal CMS proposes asset risk must protect against extreme market events Extreme markets events are defined as the maximum loss (over a certain time period) for each asset class The asset risk is calculated as the weighted sum of the maximum loss for each asset class, where the weights are the distribution of assets by class ? Assumes asset classes are 100% correlated ? ? Asset risk classes are too broad (also applies to ITAP model) Risk capital requirements unresponsive to market cycles (also applies to ITAP model) 14
RBC formula ITAP proposal Assume the 3 risk classes are independent Capital required per scheme = ????????? ????2+ ??????????? ????2+ ????? ????2 Add a 25% buffer Solvency >= 125% of RBC: Sufficient capital 100% <= Solvency < 125% of RBC: Submit business plan to CMS <100% of RBC: more stringent intervention required Liability and Operational risk figures were calculated for all schemes for 2015 Asset splits are not available in the CMS report so could not calculate that Will show illustrative impacts 15
Results ITAP proposal 250% 100.0% Solvency as % of risk contributions 90.0% 200% 80.0% RBC / Actual Solvency 70.0% 150% 60.0% 50.0% 100% 40.0% 30.0% 50% 20.0% 10.0% 0.0% 0% Open Open Open Open Open Open Open Open Restricted Restricted Restricted Restricted Restricted Restricted Restricted Restricted Restricted Restricted Restricted Restricted Restricted Restricted Restricted Restricted Restricted Restricted Restricted Restricted Total Risk (Excluding asset risk) Solvency / Risk 16
Results ITAP proposal After taking out the schemes that subsequently amalgamated: <100% of RBC 6 9 15 <125% of RBC 7 12 19 Number of schemes 22 60 82 Open Restricted Total 5 of the 15 schemes were below 25% in 2015 and would have had to build solvency anyway The others have had consistently large operating deficits Very few schemes are thus negatively impacted compared to their 2015 position 17
Impact of Asset Risk ITAP proposal Example 1: Asset split as follows: Cash: 65% Property: 5% Bonds: 20% Equities: 10% Asset risk term = 6.6% If Total risk (excluding asset risk) was 30%, this would increase to 30.7% Example 2: Asset split as follows: Cash: 30% Property: 10% Bonds: 30% Equities: 30% Asset risk term = 14.1% If Total risk (excluding asset risk) was 30%, this would increase to 33.1% The more risky the asset mix, the greater the required solvency 18
Pricing for an operating deficit The formula will penalise a scheme for pricing for operating deficits RBC increases by more than the recent deficit Example 1: Scheme has had only operating surpluses Operational risk of 3% Financial risk of 16.6% Total risk (excluding asset risk) is thus: 16.9% Example 2: Same scheme but with an operating deficit of 5% of contributions in prior year Financial risk increases to 24.1% Total risk (excluding asset risk) is now: 24.2% Example 3: Same scheme as Example 1 but with an operating deficit of 5% of contributions in prior 2 years Financial risk increases to 29.1% Total risk (excluding asset risk) is now: 29.3% 19
Example 1 ITAP proposal Scheme size: 19 000 lives Operating result: Year(t-1): 2m Year(t-2): -1m Year(t-3): -11m Net Contributions: R216m Current reserves: R129m Impairment losses: R4m Fees: R21m per annum Cash: Property: Bonds: Equities: 65% 5% 20% 10% Liability Risk: {- [(0 x 3 + -1 x 2 + -11 x 1) / 6] / 216} + 12.9% + 10.0% = 23.9% Operational Risk: 4 / 216 + 21 / 12 x 2.5 / 216 = 3.9% Asset Risk: 65% x 0.03% + 5% x 10.1% + 20% x 17.7% + 10% x 25.8% = 6.6% Total Risk: 23.9%2 + 3.9%2 + 6.6%2 = 25.1% or 25.1% x 216 = R54.2m Capital adequacy: 129 / 54.2 = 2.4 20
Example 2 ITAP proposal Scheme size: 19 000 lives Operating result: Year(t-1): -22m Year(t-2): -1m Year(t-3): -11m Net Contributions: R194m Current reserves: R107m Impairment losses: R5m Fees: R18m per annum Cash: Property: Bonds: Equities: 30% 10% 30% 30% Liability Risk: {- [(-22 x 3 + -1 x 2 + -11 x 1) / 6] / 194} + 12.9% + 10.0% = 29.7% Operational Risk: 5 / 194 + 18 / 12 x 2.5 / 194 = 4.5% Asset Risk: 30% x 0.03% + 10% x 10.1% + 30% x 17.7% + 30% x 25.8% = 14.1% Total Risk: 29.7%2 + 4.5%2 + 14.1%2 = 33.2% or 33.2% x 194 = R64.4m Capital adequacy: 107 / 64.4 = 1.7 21
Conclusion ITAP model Some further work required to refine ITAP proposal ITAP model relatively simple to establish to allow a move to an RBC approach Very few schemes negatively impacted In most cases solvency for impacted schemes are below the required levels currently Accumulated funds at an industry level unlikely to reduce as RBC requirements increase if a scheme prices for an operating loss Member security will thus not decrease Contribution increases can be lower as schemes can price for lower but more appropriate solvency levels Schemes are able to reduce their solvency requirements by managing their risks better 22
Closing remarks on the CMS model The industry welcomes the initiative by the CMS to review the current solvency framework The industry appreciates that the CMS recognizes the shortcomings of the current solvency framework and the impact of these shortcomings on the sustainability of medical schemes The discussion document published by the CMS in November 2015 recognizes that the process of determining adequate capital requirements is multi-faceted with a myriad of factors that must be considered to efficiently protect schemes against their individual risks The industry appreciates the CMS s collaborative stance, and stakeholders are looking forward to working with the CMS to determine the best RBC framework for the industry 23