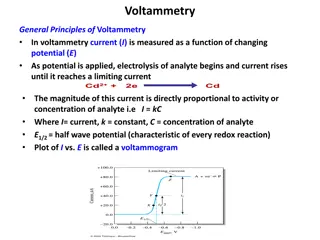
Understanding California's 2023 Local Indicator Process

The 2023 Local
Indicator Process
California Department of
Education
January 17, 2023
Webinar Series
Thursday, January 26th at 3 p.m.
•
Required Goals
2
Template Files
•
The LCAP Template:
https://www.cde.ca.gov/re/lc/documents/adoptedlcaptempla
te.docx
•
LCAP Action Tables Template:
https://www.cde.ca.gov/re/lc/documents/lcapactiontables.xlsx
•
The Budget Overview for Parents Template:
https://www.cde.ca.gov/re/lc/documents/budgetoverviewpar
ent.xlsx
California Department of Education
3
Purpose
•
Review California’s State
Accountability System
•
Review the Local Indicator
Performance standards and
reporting requirements
•
Review the connection
between the local indicators &
the LCAP
•
Provide an example of using
local indicator data to inform
the LCAP
4
Intended
Audience
The intended audience for this
presentation is anyone who will
complete, review, or interact with the
2023–24 LCAP or local indicator process,
including
•
Parents
•
Students
•
Teachers
•
Administrators
•
Advisory committee members
•
Members of governing boards or
bodies
•
Community members
5
California’s Accountability
System
Improving Student Outcomes Across the State Priorities
6
The Local Control and
Accountability Plan
As part of the Local Control Funding Formula (LCFF) , school districts, county
offices of education (COEs), and charter schools (also referred to as local
educational agencies or LEAs) are required to develop, adopt, and
annually update a three-year LCAP using the template adopted by the
California State Board of Education (SBE)
The LCAP must include a description of the annual goals to be achieved for
each student group for each state priority and for any local priorities
identified by the local governing board or body of the school district or
COE, or in the charter school petition
The LCAP must include an annual review of the effectiveness of the goals,
actions, and services from the prior year
7
LCFF State Priorities
1.
Priority 1: Appropriate teacher
assignment, sufficient
instructional materials, and
facilities in good repair
2.
Priority 2: Implementation of
academic content and
performance standards adopted
by SBE
3.
Priority 3: Parental Involvement
and Family Engagement
4.
Priority 4: Student Achievement
5.
Priority 5: Student Engagement
6.
Priority 6: School Climate
7.
Priority 7: Course Access
8.
Priority 8: Other Student
Outcomes
9.
Priority 9: Coordination of
Services for Expelled Students
(COEs only)
10.
Priority 10: Coordination of
Services for Foster Youth (COEs
only)
8
Multiple Measures
•
The Local Control Funding Formula (LCFF) created an accountability
system that utilizes multiple measures to inform educators, parents, and
the public of student achievement
•
Statute required the SBE to develop evaluation rubrics to
•
assist school districts, COEs, and charter schools (also referred to as
local educational agencies or LEAs) in evaluating their strengths,
weaknesses, and areas that require improvement, and
•
assist in identifying LEAs in need of technical assistance and the
specific priorities that the technical assistance should focus on
9
State and Local Indicators
•
The SBE adopted state and local indicators to measure school district
and individual schoolsite performance in regard to each of the state
priorities, as required by law
•
Performance data on state and local indicators is publicly reported in the
California School Dashboard (Dashboard)
•
State Indicators apply to all LEAs, schools, and student groups and are
based on data that is collected consistently across the state (Priorities
4, 5, 6 and 8)
•
Local Indicators apply at the LEA and charter school level and are
based on data collected at the local level (Priorities 1, 2, 3, 6, 7, 9 and
10)
10
2022 Dashboard
•
LEAs will use the 2022 Dashboard state and local indicator data to inform
the 2023-24 LCAP
•
The CDE has put together a Dashboard Communication Toolkit to aid in
the navigation of the 2022 Dashboard.
•
The Communication Toolkit can be accessed on the CDE website
at:
https://www.cde.ca.gov/ta/ac/cm/dashboardtoolkit.asp
11
Informing the LCAP (diagram)
12
The Local Indicators
Measuring LEA Progress and Implementation for Certain State Priorities
13
What are Local Indicators?
•
State data is not available for some priority areas identified in the LCFF
statute
•
For these priority areas, the SBE approved the local indicators, which are
based on information that an LEA collects locally
•
Local indicators apply to all LEAs
•
Local indicators do not apply to individual schools, with the
exception of single-school districts and charter schools
14
Local Indicators
•
Priority 1 (Basic Conditions of
Learning)
•
Priority 2 (Implementation of
State Academic Standards)
•
Priority 3 (Parental Involvement
and Family Engagement)
•
Priority 6 (School Climate, as
measured by a local climate
survey)
•
Priority 7 (Access to a Broad
Course of Study)
•
Priority 9 (Coordination of Services
for Expelled Youth) - COEs only
•
Priority 10 (Coordination of
Services for Foster Youth) - COEs
only
15
Performance Standards
The SBE has approved the following performance standards for each of the
local indicators:
1.
Annually measure its progress in meeting the requirements of the specific
LCFF priority.
2.
Report the results as part of a non-consent item at the same public
meeting of the local governing board/body in which the LCAP is
adopted.
3.
Report results to the public through the Dashboard utilizing the SBE-
adopted self-reflection tools for each local indicator.
16
Performance Ratings
•
An LEA that meets all three of the SBE-approved performance standards
for a local indicator will receive a performance rating of “Met” for that
local indicator in the Dashboard.
•
An LEA that does not meet all three of the SBE-approved performance
standards for a local indicator will receive a performance rating of “Not
Met” for that local indicator in the Dashboard.
•
An LEA that does not meet all three of the SBE-approved performance
standards for a local indicator for two or more consecutive years will
receive a performance rating of “Not Met for Two or More Years” for that
local indicator in the Dashboard.
•
NOTE:
For the 2022 Dashboard, "Not Met for Two or More Years" will not
be a performance rating. For the 2023 Dashboard, "Not Met for Two or
More Years" will be a performance rating.
17
"Annually measure its progress"
As an LEA prepares for the process of measuring progress annually for each
local indicator, it is helpful to:
•
Become familiar with the Local Indicators and the corresponding self-
reflection tools
•
Determine what data to collect and how to collect it, if applicable
•
Collect the data
•
Analyze the data
•
Use the findings to report progress using the self-reflection tools, to
determine needs and to inform comprehensive planning in the LCAP
18
Self-Reflection Tools
•
The SBE has adopted a self-reflection tool for each of the local indicators
to facilitate the annual reporting of progress in the Dashboard.
•
These self-reflection tools are available on the CDE’s Local Indicators web
page at:
https://www.cde.ca.gov/ta/ac/cm/localindicators.asp
19
Reporting
TO THE LOCAL BOARD
Report the results as part of a
non-consent item at the same
public meeting of the
local governing board/body at
which the LCAP is adopted.
TO THE DASHBOARD
An LEA uses the SBE-adopted self-
reflection tools to report
performance through the
Dashboard.
20
Reporting Timeline
DECEMBER 2022-
APRIL 2023
•
Gather and analyze
data to evaluate the
LEA’s implementation
in each of the Local
Indicators
ON OR BEFORE JULY
1, 2023
•
R
e
p
o
r
t
t
h
e
L
o
c
a
l
I
n
d
i
c
a
t
o
r
r
e
s
u
l
t
s
t
o
t
h
e
l
o
c
a
l
g
o
v
e
r
n
i
n
g
b
o
a
r
d
o
r
b
o
d
y
o
f
t
h
e
L
E
A
a
t
t
h
e
s
a
m
e
p
u
b
l
i
c
m
e
e
t
i
n
g
i
n
w
h
i
c
h
t
h
e
L
C
A
P
a
n
d
t
h
e
L
E
A
'
s
b
u
d
g
e
t
i
s
a
d
o
p
t
e
d
MID-AUGUST-
SEPTEMBER 2023
•
T
h
e
L
E
A
’
s
D
a
s
h
b
o
a
r
d
C
o
o
r
d
i
n
a
t
o
r
r
e
p
o
r
t
s
t
h
e
L
o
c
a
l
I
n
d
i
c
a
t
o
r
r
e
s
u
l
t
s
t
o
t
h
e
D
a
s
h
b
o
a
r
d
21
Dashboard Coordinator
22
The Role of the Dashboard
Coordinator (1)
The role of the Dashboard Coordinator includes:
•
Uploading local indicator information;
•
(Note: Dashboard Coordinators must report their LEA’s local
indicators during the reporting window to avoid receiving a
performance rating of “Not Met”).
•
Checking information for accuracy and making sure all
required elements have been addressed prior to submitting; and
•
Reviewing preview information for accuracy before the Dashboard goes
public.
23
The Role of the Dashboard
Coordinator (2)
Post Dashboard Release
•
Dashboard Coordinators are encouraged to utilize the Optional
Narrative box to share and explain aspects of the information the LEA
provided.
•
Add hyperlink(s) to other reports. This allows an LEA to go beyond the
character limit to highlight the wonderful things happening in the
LEA.
•
If deadline was missed, explain why and add a hyperlink to the
governing board/body’s meeting agenda
24
MyCDEconnect
•
MyCDEconnect
(
https://mycdeconnect.org/
)
is the CDE’s new unified system
•
This system has been developed for the convenience of LEAs to manage
multiple program reports
all in one location.
•
In the myCDEconnect unified system, LEAs can:
•
register for one or more programs at one time
•
work on their program reports in one location, and
•
do all of this through one login user account.
•
Current Program:
School Accountability Report Card (SARC)
•
Upcoming Programs:
•
2023:
Accountability Listserv, California School Dashboard Coordinators
•
2024
: LCAP e-Template
25
Informing the LCAP
The connection between local indicator data and the LCAP
26
The LCAP
•
As we have discussed in previous webinars, the LCAP development
process serves three distinct, but related functions:
1.
Comprehensive Strategic Planning
2.
Meaningful Engagement of Educational Partners
3.
Accountability and Compliance
•
Data collected as part of the
local indicator process
provides LEAs with a
rich source of timely information that can be used along with state data,
as applicable, to
develop
goals and actions within the
LCAP that
are
seek to address
the unique needs of students within the LEA.
27
Where does local data show
up in the LCAP?
•
Plan Summary
(local indicators are explicitly referenced in the instructions)
•
Engaging Educational Partners
(local indicator data can inform feedback)
•
Goals and Actions
(local indicators are explicitly referenced in the instructions
and local indicator data can inform the identification of needs, progress and
effectiveness)
•
Increased or Improved Services
(local indicator data can inform the
identification of needs, progress and effectiveness)
28
Priority 1: Basic Services and
Conditions
No changes have been made for the instructional materials and facilities
portion for Priority 1.
In June 2022, the state published the first year of teaching assignment
monitoring outcome data, which must now be used to inform the teacher
piece of Priority 1.
29
Teaching Assignment Monitoring
Outcome Data and the LCAP
•
On October 20, 2022, LASSO co-hosted a Thursday@3 Office hours with
the Teacher Learning and Policy Office
•
Teaching Assignment Monitoring Outcome Data and the LCAP
•
Teacher Assignment and Monitoring Outcomes webpage
•
LEAs are encouraged to become familiar with the TAMO reports on
the Teaching Assignment Monitoring Outcomes webpage.
30
Reporting Priority 1 in the
Dashboard
•
The 2022 Dashboard reports the prepopulated teacher assignment
portion of the Local Indicator for Priority 1.
•
LEAs continue to report the number/percentage of students without
access to their own copies of standards-aligned instructional materials for
use at school and at home and the number of identified instances where
facilities do not meet the “good repair” standard (including deficiencies
and extreme deficiencies) in the Dashboard as usual.
31
Requirement to Reflect School-
Level Data Background
•
In 2020,
Education Code
(
EC
) Section 52064.5 was revised to require that
local indicators reflect school-level data when CDE collects or has
access to that data. This is in contrast to the locally collected data
typically used for local indicators.
•
The first local indicator to be impacted by this change is the teacher
assignment portion of Priority 1.
•
CDE has convened an Ad Hoc work group on Priority 1, which will provide
input on the implementation of this change.
•
Beginning with the 2023 Dashboard, LEAs will no longer input locally
collected data on the teacher element of Priority 1.
32
Example
An example of how an LEA might use the local indicator process
to report progress and inform decision-making as related to
Priority 3: Parental Involvement and Family Engagement
33
Disclaimer
The following is provided as an
example. The example is not
exhaustive, nor does it speak
to the unique local context of
each LEA. It is merely provided
to demonstrate how
information collected as part
of the local indicator process
may be used to inform an LEA
and its community.
34
Example of an LEA’s Process (1
of 4)
•
Met with staff and advisory committees to:
•
Familiarize them with the revised self-reflection tool for Priority 3
•
Review the prior practice, process and data and evaluate if progress
has been made
•
Determine if updates to the process are needed, and if additional
data is needed to inform responses to the ratings and the prompts
•
If additional data is needed, solicit input regarding what data to
collect from appropriate educational partners
35
Example of an LEA’s Process (2
of 4)
•
Used multiple strategies for collecting data, making sure information is
accessible
•
Sent surveys in multiple languages to families, teachers, and staff
•
Met with all parent advisory committees at LEA level, SSCs to request
input on each section of the tool
•
Input opportunities (virtual and in person) were provided to parents,
teachers, and other educational partners
•
Attended various community events and requested input
36
Example of an LEA’s Process (3
of 4)
•
Reviewed data collected and determined whether deeper probing was
needed to understand findings
•
Determined how the information could inform the LCAP
•
Completed the self-reflection tool based on data findings and input from
educational partners
•
Reported progress to the local board at the same meeting in which the
LCAP was adopted and to the Dashboard
37
Example of an LEA’s Process
(4 of 4)
Based on the analysis of educational partner input and local data, identify
the number which best indicates the LEA’s current stage of implementation
for each of the 12 practices using the following rating scale (lowest to
highest):
1 – Exploration and Research Phase
2 – Beginning Development
3 – Initial Implementation
4 – Full Implementation
5 – Full Implementation and Sustainability
38
Example of Ratings for Building
Relationships (Section 1)(1 of 2)
39
Example of Ratings for Building
Relationships (Section 1)(2 of 2)
40
Prompt 1
Instructions
Section 1: Building
Relationships Dashboard Narrative Boxes
(Limited to 3,000 characters)
•
Based on the analysis of educational
partner input and local data, briefly
describe the LEA’s current strengths
and progress in Building Relationships
Between School Staff and Families.
41
Example of a Response to
Prompt 1 (1 of 2)
Feedback from educational partners and data analysis has identified the
following strengths:
•
The district communicate with families early, often, in multiple
formats/languages
•
The district provides multiple opportunities for families and staff members
to provide input in a variety of ways
•
The district provides multiple opportunities to build
relationships/partnerships
•
Schools within the district provide welcoming campuses for families
42
Example of a Response to
Prompt 1 (2 of 2)
Feedback and data analysis have also identified the following successes in
the past year:
•
The district has improved it’s engagement practices by providing
additional resources to support staff in sustaining strong
relationship/partnerships with families, providing opportunities for families
to share about their family and child, and by providing professional
development opportunities for both staff and families focused on building
relationships/partnerships for student success.
•
The district has also made significant efforts in seeking to honor the
contributions, languages, cultures, and needs of both families and staff.
43
Prompt 2
Instructions
Section 1: Building
Relationships Dashboard Narrative Boxes
(Limited to 3,000 characters)
•
Based on the analysis of educational
partner input and local data, briefly
describe the LEA's focus area(s) for
improvement in Building Relationships
Between School Staff and Families.
44
Example of a Response to
Prompt 2
The following focus areas will be addressed in Goal 2 of the LCAP:
•
Time for teachers and families to collaborate in the development of goals
for students
•
Professional learning to continue supporting teachers to work with families
around student needs and goals
•
Identifying methods to improve engagement with underrepresented
families
45
Prompt 3
Instructions
Section 1: Building
Relationships Dashboard Narrative Boxes
(Limited to 3,000 characters)
•
Based on the analysis of educational
partner input and local data, briefly
describe how the LEA will improve
engagement of underrepresented
families identified during the self-
reflection process in relation to
Building Relationships Between School
Staff and Families
46
Example of a Response to
Prompt 3
The district will improve engagement of underrepresented families by hiring
additional Family and Community Engagement staff to support teachers to
(1) identify underrepresented families, contact families, identify potential
barriers to engagement and options to address barriers; and
(2) Support teachers to maintain communication with these families, and
improve engagement.
47
Example: Metrics (1 of 2)
48
Example: Metrics (2 of 2)
49
Example: Actions (1 of 3)
50
Example: Actions (2 of 3)
51
Example: Actions (3 of 3)
52
Closing Thoughts
53
Closing Thoughts (1)
•
Engaging educational partners
•
Reflecting on prior practice/process/data
•
Basing responses on local data
•
Reviewing all responses to each self-reflection tool to ensure that all
required aspects of the self-reflection tool are addressed.
•
Considering how the local indicator process can inform the LCAP
development process in a meaningful way
54
Upcoming
Webinars
Thursday, January 26th at
3 p.m.
•
LCAP Required Goals
55
Questions?
Please contact
Local Agency Systems
Support Office
LCFF@cde.ca.gov
56
Thank You!
We appreciate you joining us today.
57
Explore the 2023 Local Indicator Process by California Department of Education, including webinars, templates, purpose review, intended audience, accountability system, and the Local Control and Accountability Plan (LCAP) requirements for school districts, COEs, and charter schools to improve student outcomes.

Download Presentation

Please find below an Image/Link to download the presentation.
The content on the website is provided AS IS for your information and personal use only. It may not be sold, licensed, or shared on other websites without obtaining consent from the author. Download presentation by click this link. If you encounter any issues during the download, it is possible that the publisher has removed the file from their server.
E N D
Presentation Transcript
The 2023 Local Indicator Process California Department of Education January 17, 2023
Webinar Series Thursday, January 26th at 3 p.m. Required Goals 2
Template Files The LCAP Template: https://www.cde.ca.gov/re/lc/documents/adoptedlcaptempla te.docx LCAP Action Tables Template: https://www.cde.ca.gov/re/lc/documents/lcapactiontables.xlsx The Budget Overview for Parents Template: https://www.cde.ca.gov/re/lc/documents/budgetoverviewpar ent.xlsx 3 California Department of Education
Purpose Review California s State Accountability System Review the Local Indicator Performance standards and reporting requirements Review the connection between the local indicators & the LCAP Provide an example of using local indicator data to inform the LCAP 4
The intended audience for this presentation is anyone who will complete, review, or interact with the 2023 24 LCAP or local indicator process, including Parents Students Teachers Administrators Advisory committee members Members of governing boards or bodies Community members Intended Audience 5
Californias Accountability System Improving Student Outcomes Across the State Priorities 6
The Local Control and Accountability Plan As part of the Local Control Funding Formula (LCFF) , school districts, county offices of education (COEs), and charter schools (also referred to as local educational agencies or LEAs) are required to develop, adopt, and annually update a three-year LCAP using the template adopted by the California State Board of Education (SBE) The LCAP must include a description of the annual goals to be achieved for each student group for each state priority and for any local priorities identified by the local governing board or body of the school district or COE, or in the charter school petition The LCAP must include an annual review of the effectiveness of the goals, actions, and services from the prior year 7
LCFF State Priorities 5. Priority 5: Student Engagement 6. Priority 6: School Climate 7. Priority 7: Course Access 8. Priority 8: Other Student Outcomes 9. Priority 9: Coordination of Services for Expelled Students (COEs only) 10.Priority 10: Coordination of Services for Foster Youth (COEs only) 1. Priority 1: Appropriate teacher assignment, sufficient instructional materials, and facilities in good repair 2. Priority 2: Implementation of academic content and performance standards adopted by SBE 3. Priority 3: Parental Involvement and Family Engagement 4. Priority 4: Student Achievement 8
Multiple Measures The Local Control Funding Formula (LCFF) created an accountability system that utilizes multiple measures to inform educators, parents, and the public of student achievement Statute required the SBE to develop evaluation rubrics to assist school districts, COEs, and charter schools (also referred to as local educational agencies or LEAs) in evaluating their strengths, weaknesses, and areas that require improvement, and assist in identifying LEAs in need of technical assistance and the specific priorities that the technical assistance should focus on 9
State and Local Indicators The SBE adopted state and local indicators to measure school district and individual schoolsite performance in regard to each of the state priorities, as required by law Performance data on state and local indicators is publicly reported in the California School Dashboard (Dashboard) State Indicators apply to all LEAs, schools, and student groups and are based on data that is collected consistently across the state (Priorities 4, 5, 6 and 8) Local Indicators apply at the LEA and charter school level and are based on data collected at the local level (Priorities 1, 2, 3, 6, 7, 9 and 10) 10
2022 Dashboard LEAs will use the 2022 Dashboard state and local indicator data to inform the 2023-24 LCAP The CDE has put together a Dashboard Communication Toolkit to aid in the navigation of the 2022 Dashboard. The Communication Toolkit can be accessed on the CDE website at: https://www.cde.ca.gov/ta/ac/cm/dashboardtoolkit.asp 11
The Local Indicators Measuring LEA Progress and Implementation for Certain State Priorities 13
What are Local Indicators? State data is not available for some priority areas identified in the LCFF statute For these priority areas, the SBE approved the local indicators, which are based on information that an LEA collects locally Local indicators apply to all LEAs Local indicators do not apply to individual schools, with the exception of single-school districts and charter schools 14
Local Indicators Priority 7 (Access to a Broad Course of Study) Priority 9 (Coordination of Services for Expelled Youth) - COEs only Priority 10 (Coordination of Services for Foster Youth) - COEs only Priority 1 (Basic Conditions of Learning) Priority 2 (Implementation of State Academic Standards) Priority 3 (Parental Involvement and Family Engagement) Priority 6 (School Climate, as measured by a local climate survey) 15
Performance Standards The SBE has approved the following performance standards for each of the local indicators: 1. Annually measure its progress in meeting the requirements of the specific LCFF priority. 2. Report the results as part of a non-consent item at the same public meeting of the local governing board/body in which the LCAP is adopted. 3. Report results to the public through the Dashboard utilizing the SBE- adopted self-reflection tools for each local indicator. 16
Performance Ratings An LEA that meets all three of the SBE-approved performance standards for a local indicator will receive a performance rating of Met for that local indicator in the Dashboard. An LEA that does not meet all three of the SBE-approved performance standards for a local indicator will receive a performance rating of Not Met for that local indicator in the Dashboard. An LEA that does not meet all three of the SBE-approved performance standards for a local indicator for two or more consecutive years will receive a performance rating of Not Met for Two or More Years for that local indicator in the Dashboard. NOTE: For the 2022 Dashboard, "Not Met for Two or More Years" will not be a performance rating. For the 2023 Dashboard, "Not Met for Two or More Years" will be a performance rating. 17
"Annually measure its progress" As an LEA prepares for the process of measuring progress annually for each local indicator, it is helpful to: Become familiar with the Local Indicators and the corresponding self- reflection tools Determine what data to collect and how to collect it, if applicable Collect the data Analyze the data Use the findings to report progress using the self-reflection tools, to determine needs and to inform comprehensive planning in the LCAP 18
Self-Reflection Tools The SBE has adopted a self-reflection tool for each of the local indicators to facilitate the annual reporting of progress in the Dashboard. These self-reflection tools are available on the CDE s Local Indicators web page at: https://www.cde.ca.gov/ta/ac/cm/localindicators.asp 19
Reporting TO THE LOCAL BOARD Report the results as part of a non-consent item at the same public meeting of the local governing board/body at which the LCAP is adopted. TO THE DASHBOARD An LEA uses the SBE-adopted self- reflection tools to report performance through the Dashboard. 20
Reporting Timeline DECEMBER 2022- APRIL 2023 ON OR BEFORE JULY 1, 2023 MID-AUGUST- SEPTEMBER 2023 Gather and analyze data to evaluate the LEA s implementation in each of the Local Indicators Report the Local Indicator results to the local governing board or body of the LEA at the same public meeting in same public meeting in which the LCAP and the which the LCAP and the LEA's budget is adopted LEA's budget is adopted The LEA s Dashboard Coordinator r reports the Local Indicator results to the Dashboard at the 21
The Role of the Dashboard Coordinator (1) The role of the Dashboard Coordinator includes: Uploading local indicator information; (Note: Dashboard Coordinators must report their LEA s local indicators during the reporting window to avoid receiving a performance rating of Not Met ). Checking information for accuracy and making sure all required elements have been addressed prior to submitting; and Reviewing preview information for accuracy before the Dashboard goes public. 23
The Role of the Dashboard Coordinator (2) Post Dashboard Release Dashboard Coordinators are encouraged to utilize the Optional Narrative box to share and explain aspects of the information the LEA provided. Add hyperlink(s) to other reports. This allows an LEA to go beyond the character limit to highlight the wonderful things happening in the LEA. If deadline was missed, explain why and add a hyperlink to the governing board/body s meeting agenda 24
MyCDEconnect MyCDEconnect (https://mycdeconnect.org/) is the CDE s new unified system This system has been developed for the convenience of LEAs to manage multiple program reports all in one location. In the myCDEconnect unified system, LEAs can: register for one or more programs at one time work on their program reports in one location, and do all of this through one login user account. Current Program: School Accountability Report Card (SARC) Upcoming Programs: 2023: Accountability Listserv, California School Dashboard Coordinators 2024: LCAP e-Template 25
Informing the LCAP The connection between local indicator data and the LCAP 26
The LCAP As we have discussed in previous webinars, the LCAP development process serves three distinct, but related functions: 1. Comprehensive Strategic Planning 2. Meaningful Engagement of Educational Partners 3. Accountability and Compliance Data collected as part of the local indicator process provides LEAs with a rich source of timely information that can be used along with state data, as applicable, to develop goals and actions within the LCAP that are seek to address the unique needs of students within the LEA. 27
Where does local data show up in the LCAP? Plan Summary(local indicators are explicitly referenced in the instructions) Engaging Educational Partners(local indicator data can inform feedback) Goals and Actions(local indicators are explicitly referenced in the instructions and local indicator data can inform the identification of needs, progress and effectiveness) Increased or Improved Services(local indicator data can inform the identification of needs, progress and effectiveness) 28
Priority 1: Basic Services and Conditions No changes have been made for the instructional materials and facilities portion for Priority 1. In June 2022, the state published the first year of teaching assignment monitoring outcome data, which must now be used to inform the teacher piece of Priority 1. 29
Teaching Assignment Monitoring Outcome Data and the LCAP On October 20, 2022, LASSO co-hosted a Thursday@3 Office hours with the Teacher Learning and Policy Office Teaching Assignment Monitoring Outcome Data and the LCAP Teacher Assignment and Monitoring Outcomes webpage LEAs are encouraged to become familiar with the TAMO reports on the Teaching Assignment Monitoring Outcomes webpage. 30
Reporting Priority 1 in the Dashboard The 2022 Dashboard reports the prepopulated teacher assignment portion of the Local Indicator for Priority 1. LEAs continue to report the number/percentage of students without access to their own copies of standards-aligned instructional materials for use at school and at home and the number of identified instances where facilities do not meet the good repair standard (including deficiencies and extreme deficiencies) in the Dashboard as usual. 31
Requirement to Reflect School- Level Data Background In 2020, Education Code (EC) Section 52064.5 was revised to require that local indicators reflect school-level data when CDE collects or has access to that data. This is in contrast to the locally collected data typically used for local indicators. The first local indicator to be impacted by this change is the teacher assignment portion of Priority 1. CDE has convened an Ad Hoc work group on Priority 1, which will provide input on the implementation of this change. Beginning with the 2023 Dashboard, LEAs will no longer input locally collected data on the teacher element of Priority 1. 32
Example An example of how an LEA might use the local indicator process to report progress and inform decision-making as related to Priority 3: Parental Involvement and Family Engagement 33
Disclaimer The following is provided as an example. The example is not exhaustive, nor does it speak to the unique local context of each LEA. It is merely provided to demonstrate how information collected as part of the local indicator process may be used to inform an LEA and its community. 34
Example of an LEAs Process (1 of 4) Met with staff and advisory committees to: Familiarize them with the revised self-reflection tool for Priority 3 Review the prior practice, process and data and evaluate if progress has been made Determine if updates to the process are needed, and if additional data is needed to inform responses to the ratings and the prompts If additional data is needed, solicit input regarding what data to collect from appropriate educational partners 35
Example of an LEAs Process (2 of 4) Used multiple strategies for collecting data, making sure information is accessible Sent surveys in multiple languages to families, teachers, and staff Met with all parent advisory committees at LEA level, SSCs to request input on each section of the tool Input opportunities (virtual and in person) were provided to parents, teachers, and other educational partners Attended various community events and requested input 36
Example of an LEAs Process (3 of 4) Reviewed data collected and determined whether deeper probing was needed to understand findings Determined how the information could inform the LCAP Completed the self-reflection tool based on data findings and input from educational partners Reported progress to the local board at the same meeting in which the LCAP was adopted and to the Dashboard 37
Example of an LEAs Process (4 of 4) Based on the analysis of educational partner input and local data, identify the number which best indicates the LEA s current stage of implementation for each of the 12 practices using the following rating scale (lowest to highest): 1 Exploration and Research Phase 2 Beginning Development 3 Initial Implementation 4 Full Implementation 5 Full Implementation and Sustainability 38
Example of Ratings for Building Relationships (Section 1)(1 of 2) Statements of Practice 1. Rate the LEA s progress in developing the capacity of staff (i.e., administrators, teachers, and classified staff) to build trusting and respectful relationships with families. 2. Rate the LEA s progress in creating welcoming environments for all families in the community. Rating 3 3 39
Example of Ratings for Building Relationships (Section 1)(2 of 2) Statements of Practice 3. Rate the LEA s progress in supporting staff to learn about each family s strengths, cultures, languages, and goals for their children. 4. The LEA s progress in developing multiple opportunities for the LEA and school sites to engage in 2-way communication between families and educators using language that is understandable and accessible to families. Rating 3 4 40
Section 1: Building Relationships Dashboard Narrative Boxes (Limited to 3,000 characters) Based on the analysis of educational partner input and local data, briefly describe the LEA s current strengths and progress in Building Relationships Between School Staff and Families. Prompt 1 Instructions 41
Example of a Response to Prompt 1 (1 of 2) Feedback from educational partners and data analysis has identified the following strengths: The district communicate with families early, often, in multiple formats/languages The district provides multiple opportunities for families and staff members to provide input in a variety of ways The district provides multiple opportunities to build relationships/partnerships Schools within the district provide welcoming campuses for families 42
Example of a Response to Prompt 1 (2 of 2) Feedback and data analysis have also identified the following successes in the past year: The district has improved it s engagement practices by providing additional resources to support staff in sustaining strong relationship/partnerships with families, providing opportunities for families to share about their family and child, and by providing professional development opportunities for both staff and families focused on building relationships/partnerships for student success. The district has also made significant efforts in seeking to honor the contributions, languages, cultures, and needs of both families and staff. 43
Section 1: Building Relationships Dashboard Narrative Boxes (Limited to 3,000 characters) Based on the analysis of educational partner input and local data, briefly describe the LEA's focus area(s) for improvement in Building Relationships Between School Staff and Families. Prompt 2 Instructions 44
Example of a Response to Prompt 2 The following focus areas will be addressed in Goal 2 of the LCAP: Time for teachers and families to collaborate in the development of goals for students Professional learning to continue supporting teachers to work with families around student needs and goals Identifying methods to improve engagement with underrepresented families 45
Section 1: Building Relationships Dashboard Narrative Boxes (Limited to 3,000 characters) Based on the analysis of educational partner input and local data, briefly describe how the LEA will improve engagement of underrepresented families identified during the self- reflection process in relation to Building Relationships Between School Staff and Families Prompt 3 Instructions 46
Example of a Response to Prompt 3 The district will improve engagement of underrepresented families by hiring additional Family and Community Engagement staff to support teachers to (1) identify underrepresented families, contact families, identify potential barriers to engagement and options to address barriers; and (2) Support teachers to maintain communication with these families, and improve engagement. 47
Example: Metrics (1 of 2) Desired Outcome for 2023 24 All:100% LI: 100% EL: 100% FY: 100% Year 1 Outcome Year 2 Outcome Metric Baseline Year 3 % of families attending any family engagement event in 20- 21 All: 75% Low income (LI): 50% EL: 60% FY: 50% All: 80% LI: 53% EL: 64% FY: 50% All: 82% LI: 60% EL: 70% FY: 56% 48
Example: Metrics (2 of 2) Desired Outcome for 2023 24 100% Year 1 Outcome Year 2 Outcome Year 3 Metric Baseline % of staff that feel that PD helps staff to build family school partnerships % of families that feel that PD helps them to partner better with school 85% 90% 93% 30% 58% 65% 100% 49
Example: Actions (1 of 3) Action # Title Description Incorporate family goal setting activities into one of the three Family Engagement opportunities occurring during the 2022-23 school year. Total Funds $0 Contributing N Family Engagement Collaboration 1 50


")


")
")
")