Economic Overview of Pine Ridge Indian Reservation (2011)
The Pine Ridge Indian Reservation in 2011 experienced varying levels of establishments and employment across different districts, such as Eagle Nest, Pass Creek, La Creek, White Clay, Wounded Knee, Porcupine, Medicine Root, and an unnamed district. The reservation's economy was diversified, with notable sectors including Agriculture, Forestry, Fishing & Hunting, Manufacturing, Retail, Health Care and Social Assistance, Educational Services, and more. The employment distribution by industry sector provides insights into the economic landscape of the reservation during that year.
Download Presentation

Please find below an Image/Link to download the presentation.
The content on the website is provided AS IS for your information and personal use only. It may not be sold, licensed, or shared on other websites without obtaining consent from the author. Download presentation by click this link. If you encounter any issues during the download, it is possible that the publisher has removed the file from their server.
E N D
Presentation Transcript
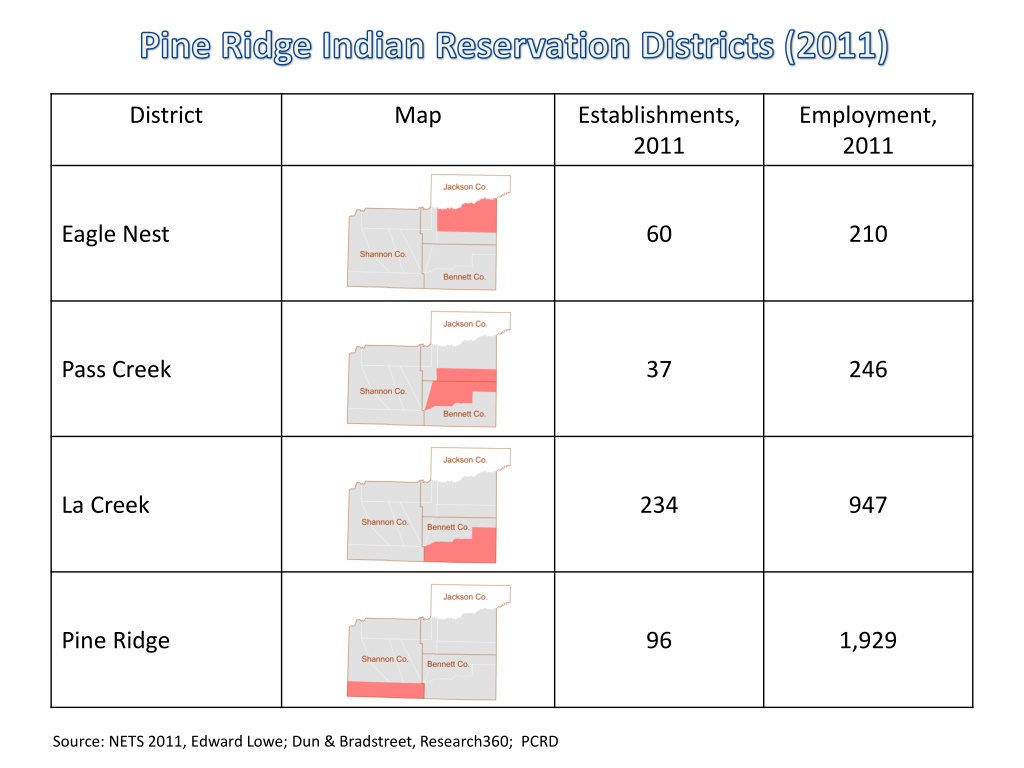
Pine Ridge Indian Reservation Districts (2011) District Map Establishments, 2011 Employment, 2011 Eagle Nest 60 210 Pass Creek 37 246 La Creek 234 947 Pine Ridge 96 1,929 Source: NETS 2011, Edward Lowe; Dun & Bradstreet, Research360; PCRD
Pine Ridge Indian Reservation Districts (2011) District Map Establishments, 2011 Employment, 2011 White Clay 21 139 Wounded Knee 92 1,054 Porcupine 27 158 Medicine Root 51 435 Source: NETS 2011, Edward Lowe; Dun & Bradstreet, Research360; PCRD
Pine Ridge Indian Reservation Districts (2011) District Map Establishments, 2011 Employment, 2011 Unnamed 64 524 Reservation Map Establishments, 2011 Employment, 2011 Pine Ridge Indian Reservation 682 5,642 Source: NETS 2011, Edward Lowe; Dun & Bradstreet, Research360; PCRD
Pine Ridge Indian Reservation (2011) Employment, 2011 Establishments, 2011 NAICS Industry Sectors Sales, 2011 11 Agriculture, Forestry, Fishing & Hunting 199 91 $ 28,765,012 22 Utilities 90 7 $ 4,950,500 23 Construction 190 45 $ 27,297,995 31-33 Manufacturing 9 6 $ 12,526,400 42 Wholesale 91 19 $ 7,117,984 44-45 Retail 280 46 $ 28,369,528 48-49 Transportation & Warehousing 37 14 $ 27,791,000 51 Information 34 9 $ 1,265,205 52 Finance & Insurance 37 8 $ 1,165,000 53 Real Estate Rental & Leasing 19 9 $ 2,745,960 54 Professional, Scientific & Technical Services 383 55 $ 25,621,731 56 Administrative Support, Waste Management, etc. 233 129 $ 68,941,768 61 Educational Services 1,436 36 $ 10,372,475 62 Health Care and Social Assistance 883 65 $ 22,242,600 71 Arts, Entertainment and Recreation 17 6 $ 885,200 72 Accommodation and Food Services 255 16 $ 2,738,200 81 Other Services 244 69 $ 35,380,152 92 Public Administration 1,175 47 $ 16,619,086 99 Unknown 30 5 $ 858,250 TOTAL 5,642 682 $ 325,654,046 Source: NETS 2011, Edward Lowe; Dun & Bradstreet, Research360; PCRD
Pine Ridge Indian Reservation (2011) Pine Ridge, Industry Sectors, Employment 2011 0.5% 1.6% Agriculture, Forestry, Fishing & Hunting 3.5% 0.2% Utilities 1.6% 3.4% Construction 0.7% Manufacturing 5.0% 0.6% Wholaesale 0.7% 0.3% Public Administration, 20.8% Retail Transportation & Warehousing Information 6.8% Finance & Insurance 4.3% Real Estate Rental & Leasing 4.1% Professional, Scientific & Technical Services 4.5% Administrative Support, Waste Management, etc. Educational Services 0.3% Health Care and Social Assistance, 15.7% Health Care and Social Assistance Educational Services, 25.5% Arts, Entertainment and Recreation Accommodation and Food Services Other Services Public Administration Unknown Source: NETS 2011, Edward Lowe; Dun & Bradstreet, Research360; PCRD
Pine Ridge Indian Reservation (2011) Pine Ridge Indian Reservation, Industry Sectors, Establishments 2011 Public Administration, 6.9% 0.7% Agriculture, Forestry, Fishing & Hunting Utilities Construction Agriculture, Forestry, Fishing & Hunting, 13.3% 1.0% Manufacturing Wholaesale Other Services, 10.1% Retail Transportation & Warehousing 2.3% 0.9% Construction, 6.6% 0.9% Information Finance & Insurance 2.8% Real Estate Rental & Leasing Health Care and Social Assistance, 9.5% Professional, Scientific & Technical Services Retail, 6.7% Administrative Support, Waste Management, etc. Educational Services 5.3% Health Care and Social Assistance 2.1% Arts, Entertainment and Recreation 1.3% Administrative Support and Waste Management, etc., 18.9% 1.2% Accommodation and Food Services 1.3% Other Services 8.1% Public Administration Unknown Source: NETS 2011, Edward Lowe; Dun & Bradstreet, Research360; PCRD
Purdue Center for Regional Development Purdue University Gerald D. and Edna E. Mann Hall, Suite 266 203 Martin Jischke Drive West Lafayette, IN 47907-2057


